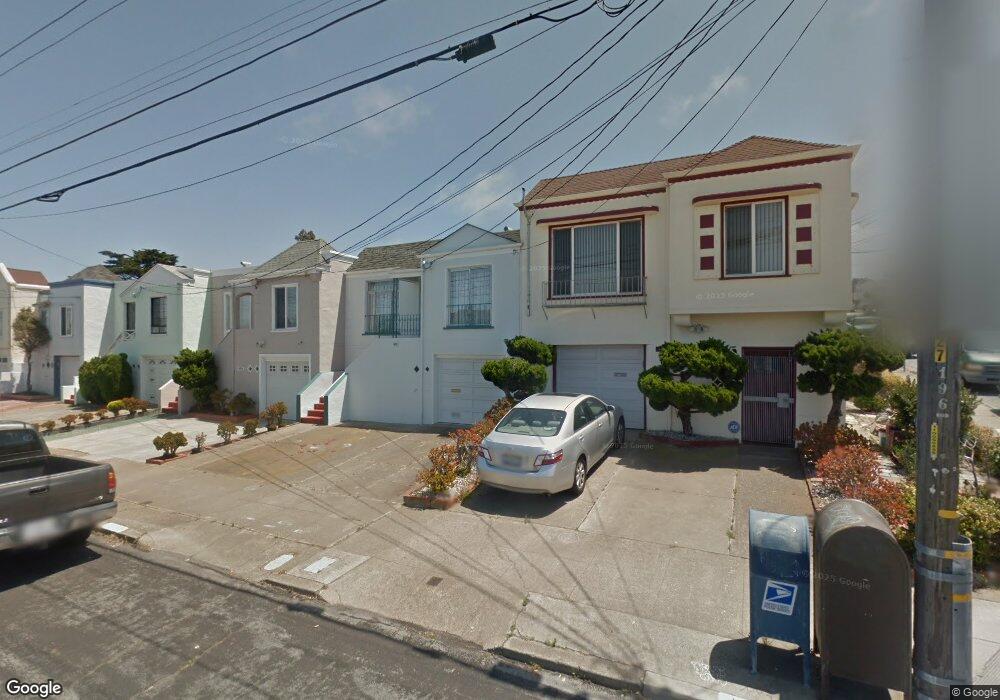
1990 34th Ave San Francisco, CA 94116
Parkside NeighborhoodEstimated Value: $1,171,000 - $1,404,000
Studio
1
Bath
800
Sq Ft
$1,674/Sq Ft
Est. Value
About This Home
This home is located at 1990 34th Ave, San Francisco, CA 94116 and is currently estimated at $1,339,372, approximately $1,674 per square foot. 1990 34th Ave is a home located in San Francisco County with nearby schools including Stevenson (Robert Louis) Elementary School, Giannini (A.P.) Middle School, and Holy Name Elementary School.
Ownership History
Date
Name
Owned For
Owner Type
Purchase Details
Closed on
Jun 4, 2024
Sold by
Huynh Steve Huy
Bought by
Steve Huy Huynh And My My Ly Revocable Living
Current Estimated Value
Purchase Details
Closed on
Dec 5, 2019
Sold by
Whitten James C and Whitten Margaret R
Bought by
Ly My My and Huynh Steve Huy
Home Financials for this Owner
Home Financials are based on the most recent Mortgage that was taken out on this home.
Original Mortgage
$726,525
Interest Rate
3.75%
Mortgage Type
New Conventional
Purchase Details
Closed on
Dec 3, 2019
Sold by
Sarmiento Virginia
Bought by
Whitten James C
Home Financials for this Owner
Home Financials are based on the most recent Mortgage that was taken out on this home.
Original Mortgage
$726,525
Interest Rate
3.75%
Mortgage Type
New Conventional
Purchase Details
Closed on
Dec 3, 2017
Sold by
Whitten James C and Whitten Blanca Aragones
Bought by
Whitten James C
Create a Home Valuation Report for This Property
The Home Valuation Report is an in-depth analysis detailing your home's value as well as a comparison with similar homes in the area
Home Values in the Area
Average Home Value in this Area
Purchase History
| Date | Buyer | Sale Price | Title Company |
|---|---|---|---|
| Steve Huy Huynh And My My Ly Revocable Living | -- | None Listed On Document | |
| Ly My My | $1,100,000 | First American Title Company | |
| Whitten James C | -- | First American Title Company | |
| Whitten James C | -- | None Available |
Source: Public Records
Mortgage History
| Date | Status | Borrower | Loan Amount |
|---|---|---|---|
| Previous Owner | Ly My My | $726,525 |
Source: Public Records
Tax History
| Year | Tax Paid | Tax Assessment Tax Assessment Total Assessment is a certain percentage of the fair market value that is determined by local assessors to be the total taxable value of land and additions on the property. | Land | Improvement |
|---|---|---|---|---|
| 2025 | $14,523 | $1,203,005 | $842,105 | $360,900 |
| 2024 | $14,523 | $1,179,418 | $825,594 | $353,824 |
| 2023 | $14,301 | $1,156,293 | $809,406 | $346,887 |
| 2022 | $14,024 | $1,133,622 | $793,536 | $340,086 |
| 2021 | $13,773 | $1,111,395 | $777,977 | $333,418 |
| 2020 | $13,839 | $1,100,000 | $770,000 | $330,000 |
| 2019 | $11,554 | $918,000 | $642,600 | $275,400 |
| 2018 | $11,165 | $900,000 | $630,000 | $270,000 |
| 2017 | $1,598 | $109,854 | $54,417 | $55,437 |
| 2016 | $1,539 | $107,700 | $53,350 | $54,350 |
| 2015 | $1,517 | $106,083 | $52,549 | $53,534 |
| 2014 | $1,218 | $104,006 | $51,520 | $52,486 |
Source: Public Records
Map
Nearby Homes
- 3327 Quintara St
- 2006 31st Ave
- 2537 Pacheco St
- 2191 33rd Ave
- 1815 29th Ave
- 2275 35th Ave
- 2114 40th Ave
- 1671 34th Ave
- 2036 Noriega St Unit 2040
- 2824 Santiago St
- 2830 Lawton St
- 1474 34th Ave
- 1711 23rd Ave
- 2082 46th Ave
- 2375 24th Ave
- 4329 Pacheco St
- 2115 20th Ave
- 2401 44th Ave Unit 1
- 2530 27th Ave
- 2020 20th Ave
Your Personal Tour Guide
Ask me questions while you tour the home.