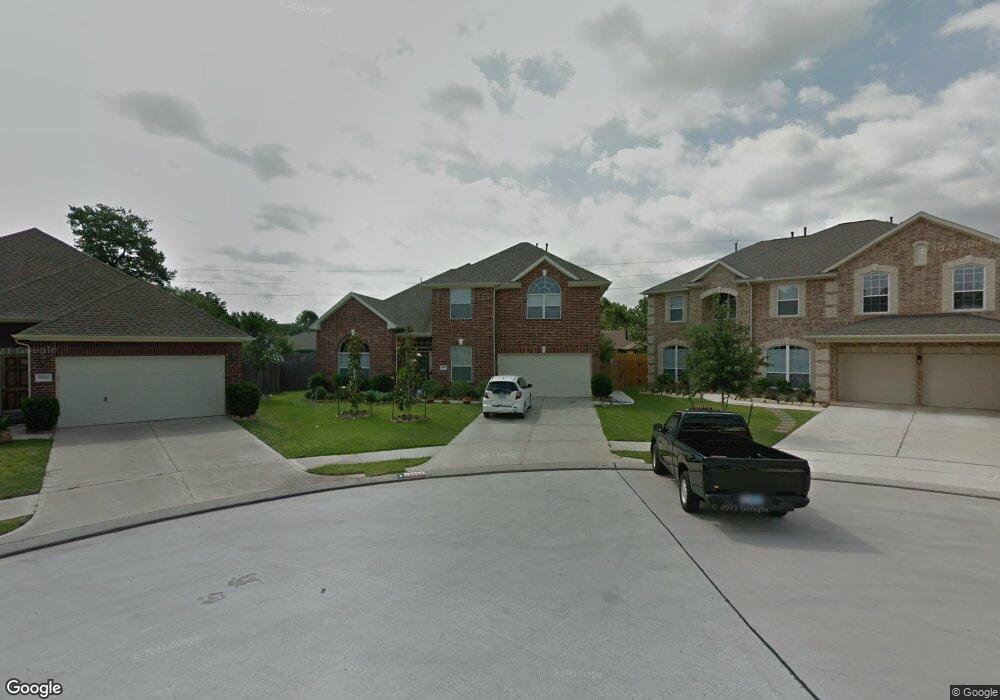
19902 Brookway Pine Ct Spring, TX 77379
Estimated Value: $367,927 - $446,000
5
Beds
4
Baths
3,022
Sq Ft
$134/Sq Ft
Est. Value
About This Home
This home is located at 19902 Brookway Pine Ct, Spring, TX 77379 and is currently estimated at $403,482, approximately $133 per square foot. 19902 Brookway Pine Ct is a home located in Harris County with nearby schools including Kuehnle Elementary School, Krimmel Intermediate School, and Klein High School.
Ownership History
Date
Name
Owned For
Owner Type
Purchase Details
Closed on
Jun 17, 2015
Sold by
Ozturk Tom T and Ozturk Yolanda Patricia
Bought by
Ozturk Tom T and Ozturk Yolanda Patricia
Current Estimated Value
Home Financials for this Owner
Home Financials are based on the most recent Mortgage that was taken out on this home.
Original Mortgage
$188,746
Outstanding Balance
$70,123
Interest Rate
3.3%
Mortgage Type
FHA
Estimated Equity
$333,359
Purchase Details
Closed on
Nov 30, 2007
Sold by
Supreme Builders Ltd
Bought by
Ozturk Tom
Home Financials for this Owner
Home Financials are based on the most recent Mortgage that was taken out on this home.
Original Mortgage
$200,355
Interest Rate
6.43%
Mortgage Type
Purchase Money Mortgage
Purchase Details
Closed on
Sep 18, 2006
Sold by
Senterra Lakes Lp
Bought by
Supreme Builders Ltd
Home Financials for this Owner
Home Financials are based on the most recent Mortgage that was taken out on this home.
Original Mortgage
$14,000,000
Interest Rate
6.55%
Mortgage Type
Purchase Money Mortgage
Create a Home Valuation Report for This Property
The Home Valuation Report is an in-depth analysis detailing your home's value as well as a comparison with similar homes in the area
Purchase History
| Date | Buyer | Sale Price | Title Company |
|---|---|---|---|
| Ozturk Tom T | -- | None Available | |
| Ozturk Tom | -- | Fidelity | |
| Supreme Builders Ltd | -- | None Available |
Source: Public Records
Mortgage History
| Date | Status | Borrower | Loan Amount |
|---|---|---|---|
| Open | Ozturk Tom T | $188,746 | |
| Previous Owner | Ozturk Tom | $200,355 | |
| Previous Owner | Supreme Builders Ltd | $14,000,000 |
Source: Public Records
Tax History
| Year | Tax Paid | Tax Assessment Tax Assessment Total Assessment is a certain percentage of the fair market value that is determined by local assessors to be the total taxable value of land and additions on the property. | Land | Improvement |
|---|---|---|---|---|
| 2025 | $6,911 | $383,681 | $50,781 | $332,900 |
| 2024 | $6,911 | $382,212 | $50,781 | $331,431 |
| 2023 | $6,911 | $412,617 | $50,781 | $361,836 |
| 2022 | $8,098 | $360,015 | $50,781 | $309,234 |
| 2021 | $7,775 | $299,428 | $44,010 | $255,418 |
| 2020 | $7,386 | $286,072 | $44,010 | $242,062 |
| 2019 | $6,939 | $249,734 | $44,010 | $205,724 |
| 2018 | $3,079 | $240,327 | $44,010 | $196,317 |
| 2017 | $6,863 | $244,000 | $44,010 | $199,990 |
| 2016 | $6,863 | $244,000 | $44,010 | $199,990 |
| 2015 | $5,699 | $250,447 | $44,010 | $206,437 |
| 2014 | $5,699 | $232,117 | $44,010 | $188,107 |
Source: Public Records
Map
Nearby Homes
- 5227 Aberton Ln
- 19718 Auburn Park Ln
- 5114 Aberton Ln
- 19718 Brentonridge Ln
- 20123 Falcon Chase Ct
- 5211 Rivertree Ln
- 5515 Pimberton Ln
- 5014 Creekbridge Ct
- 19531 Village of Bridgestone Ln
- 6027 Stone Trail Ln
- 20931 Fernhollow Ln
- 5714 Brookway Willow Dr
- 5619 Roserock Ln
- 19303 Valiant Woods Dr
- 20251 Eden Pines
- 19407 Rosebud Ridge Way
- 21102 Fernhollow Ln
- 4802 Enchanted Rock Ln
- 5810 Sequoia Trace Ct
- 21022 Waymare Ln
- 19906 Brookway Pine Ct
- 19903 Brookway Pine Ct
- 5314 Aberton Ln
- 5310 Aberton Ln
- 5318 Aberton Ln
- 19907 Brookway Pine Ct
- 19910 Brookway Pine Ct
- 19914 Brookway Pine Ct
- 5306 Aberton Ln
- 5322 Aberton Ln
- 19811 Ransten Ln
- 19815 Ransten Ln
- 19911 Brookway Pine Ct
- 19903 Ransten Ln
- 5326 Aberton Ln
- 5302 Aberton Ln
- 19907 Ransten Ln
- 19918 Brookway Pine Ct
- 19710 Aberton Ct
- 5330 Aberton Ln
Your Personal Tour Guide
Ask me questions while you tour the home.