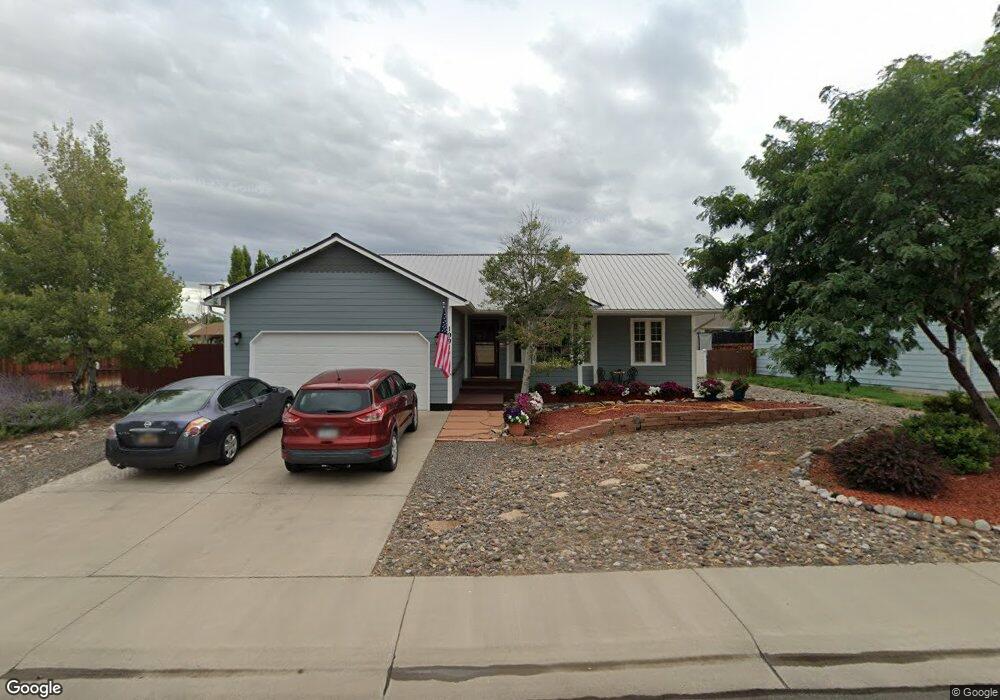
1991 Stan Dr Montrose, CO 81401
Estimated Value: $404,000 - $426,000
3
Beds
2
Baths
1,457
Sq Ft
$283/Sq Ft
Est. Value
About This Home
This home is located at 1991 Stan Dr, Montrose, CO 81401 and is currently estimated at $411,951, approximately $282 per square foot. 1991 Stan Dr is a home located in Montrose County with nearby schools including Johnson Elementary School, Centennial Middle School, and Montrose High School.
Ownership History
Date
Name
Owned For
Owner Type
Purchase Details
Closed on
May 30, 2014
Sold by
Hollinbeck Cindy M
Bought by
Hollinbeck Mark
Current Estimated Value
Purchase Details
Closed on
Dec 21, 2009
Sold by
Stender Ricky L and Stender Catherine M
Bought by
Hollinbeck Mark and Hollinbeck Cindy M
Home Financials for this Owner
Home Financials are based on the most recent Mortgage that was taken out on this home.
Original Mortgage
$144,868
Interest Rate
5.01%
Mortgage Type
Purchase Money Mortgage
Purchase Details
Closed on
Oct 27, 2003
Sold by
Great New Homes
Bought by
Stender Ricky L and Stender Catherine M
Purchase Details
Closed on
Mar 3, 2001
Sold by
Wecoland Investors
Bought by
Foxbeth Units Llc
Purchase Details
Closed on
Nov 16, 1999
Sold by
Colorado Dolphin Companies
Bought by
Wecoland Investors
Create a Home Valuation Report for This Property
The Home Valuation Report is an in-depth analysis detailing your home's value as well as a comparison with similar homes in the area
Home Values in the Area
Average Home Value in this Area
Purchase History
| Date | Buyer | Sale Price | Title Company |
|---|---|---|---|
| Hollinbeck Mark | -- | None Available | |
| Hollinbeck Mark | $181,900 | Heritage Title Company | |
| Stender Ricky L | $140,000 | -- | |
| Foxbeth Units Llc | -- | -- | |
| Wecoland Investors | $306,000 | -- |
Source: Public Records
Mortgage History
| Date | Status | Borrower | Loan Amount |
|---|---|---|---|
| Closed | Hollinbeck Mark | $144,868 |
Source: Public Records
Tax History Compared to Growth
Tax History
| Year | Tax Paid | Tax Assessment Tax Assessment Total Assessment is a certain percentage of the fair market value that is determined by local assessors to be the total taxable value of land and additions on the property. | Land | Improvement |
|---|---|---|---|---|
| 2024 | $1,088 | $21,790 | $3,150 | $18,640 |
| 2023 | $1,088 | $26,420 | $3,820 | $22,600 |
| 2022 | $1,284 | $18,390 | $2,780 | $15,610 |
| 2021 | $1,322 | $18,920 | $2,860 | $16,060 |
| 2020 | $1,120 | $16,470 | $2,470 | $14,000 |
| 2019 | $1,127 | $16,470 | $2,470 | $14,000 |
| 2018 | $892 | $12,700 | $1,990 | $10,710 |
| 2017 | $885 | $12,700 | $1,990 | $10,710 |
| 2016 | $860 | $12,550 | $2,010 | $10,540 |
| 2015 | $845 | $12,550 | $2,010 | $10,540 |
| 2014 | $698 | $11,090 | $2,010 | $9,080 |
Source: Public Records
Map
Nearby Homes
- 3208 Wheat Grass Dr
- 1833 Estates Dr Unit A
- 3208 Ravens Crest Dr
- 1987 Sara E Ln
- 1708 American Way
- 2132 Patriot Ct
- 2224 American Way
- 3004 Silver Fox Dr
- 1764 Freedom Way
- TBD Freedom Way
- 3161 Silver Fox Dr
- 2308 Mead Ln
- 2869 Cimarron St
- 1530 American Way
- 1624 Election Way
- 2398 W Fox Park St
- 2348 Mead Ln
- TBD Lot 3 E Oak Grove Rd
- TBD Lot 2 E Oak Grove Rd
- 3315 Pinewood St
- 2003 Stan Dr
- 1889 Stan Dr
- 1894 David St
- 1902 David St
- 1990 Stan Dr
- 0 Stan Dr Unit 765827
- 0 Stan Dr Unit 763251
- 0 Stan Dr Unit 761894
- 0 Stan Dr Unit 753999
- 0 Stan Dr Unit 753218
- 0 Stan Dr Unit 747753
- 0 Stan Dr Unit 747021
- 0 Stan Dr Unit 746186
- 0 Stan Dr Unit 730348
- 0 Stan Dr Unit 622018
- 0 Stan Dr Unit 622406
- 0 Stan Dr Unit 631272
- 0 Stan Dr Unit 635321
- 0 Stan Dr Unit 642415
- 0 Stan Dr Unit 648913