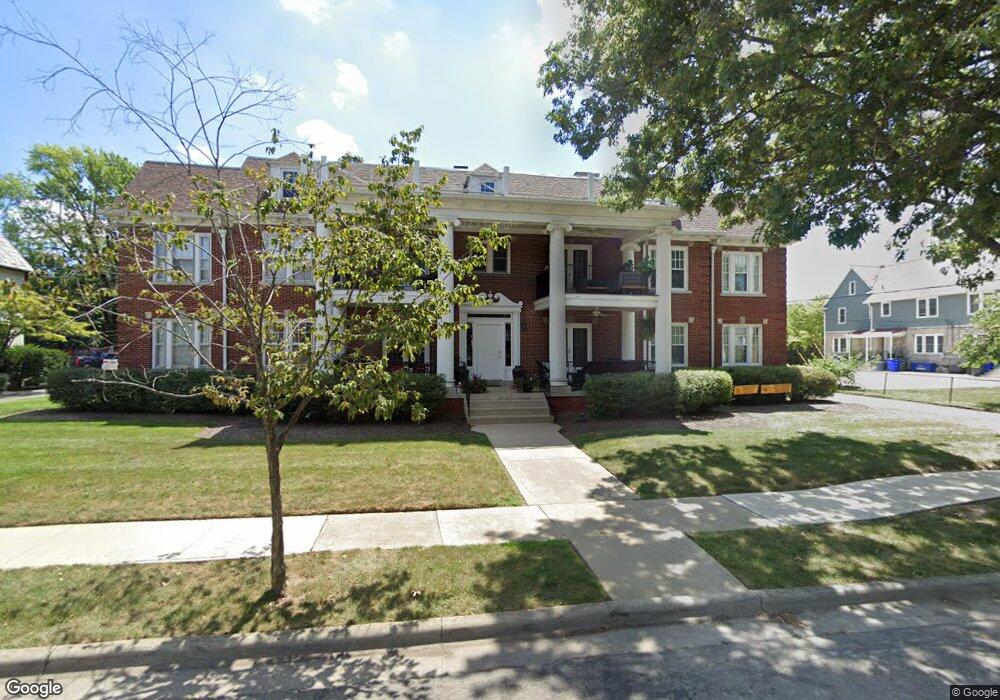
1991 Suffolk Rd Unit 4 Columbus, OH 43221
Estimated Value: $342,000 - $405,000
3
Beds
2
Baths
1,650
Sq Ft
$223/Sq Ft
Est. Value
About This Home
This home is located at 1991 Suffolk Rd Unit 4, Columbus, OH 43221 and is currently estimated at $367,355, approximately $222 per square foot. 1991 Suffolk Rd Unit 4 is a home located in Franklin County with nearby schools including Barrington Road Elementary School, Jones Middle School, and Upper Arlington High School.
Ownership History
Date
Name
Owned For
Owner Type
Purchase Details
Closed on
Aug 18, 2010
Sold by
Exstra Llc
Bought by
Ray Michael J and Ray Rachel S
Current Estimated Value
Home Financials for this Owner
Home Financials are based on the most recent Mortgage that was taken out on this home.
Original Mortgage
$189,050
Outstanding Balance
$125,233
Interest Rate
4.58%
Mortgage Type
New Conventional
Estimated Equity
$242,122
Purchase Details
Closed on
Mar 8, 2007
Sold by
Sugar David E
Bought by
Exstra Llc
Purchase Details
Closed on
Aug 4, 1997
Sold by
Boyle William F and Boyle Sheila R
Bought by
Sugar David E
Home Financials for this Owner
Home Financials are based on the most recent Mortgage that was taken out on this home.
Original Mortgage
$117,000
Interest Rate
7.71%
Purchase Details
Closed on
Jun 16, 1995
Sold by
Suffolk Road Ptns
Bought by
Boyle William F and Boyle Sheila R
Create a Home Valuation Report for This Property
The Home Valuation Report is an in-depth analysis detailing your home's value as well as a comparison with similar homes in the area
Home Values in the Area
Average Home Value in this Area
Purchase History
| Date | Buyer | Sale Price | Title Company |
|---|---|---|---|
| Ray Michael J | $199,000 | Talon Group | |
| Exstra Llc | $182,000 | Integrated | |
| Sugar David E | $117,000 | Franklin Abstract | |
| Boyle William F | $95,000 | -- |
Source: Public Records
Mortgage History
| Date | Status | Borrower | Loan Amount |
|---|---|---|---|
| Open | Ray Michael J | $189,050 | |
| Previous Owner | Sugar David E | $117,000 | |
| Closed | Boyle William F | -- |
Source: Public Records
Tax History Compared to Growth
Tax History
| Year | Tax Paid | Tax Assessment Tax Assessment Total Assessment is a certain percentage of the fair market value that is determined by local assessors to be the total taxable value of land and additions on the property. | Land | Improvement |
|---|---|---|---|---|
| 2024 | $5,361 | $92,610 | $28,000 | $64,610 |
| 2023 | $5,295 | $92,610 | $28,000 | $64,610 |
| 2022 | $5,657 | $80,960 | $26,990 | $53,970 |
| 2021 | $5,008 | $80,960 | $26,990 | $53,970 |
| 2020 | $4,964 | $80,960 | $26,990 | $53,970 |
| 2019 | $4,878 | $70,350 | $23,450 | $46,900 |
| 2018 | $4,787 | $70,350 | $23,450 | $46,900 |
| 2017 | $4,785 | $70,350 | $23,450 | $46,900 |
| 2016 | $4,728 | $71,510 | $16,560 | $54,950 |
| 2015 | $4,724 | $71,510 | $16,560 | $54,950 |
| 2014 | $4,729 | $71,510 | $16,560 | $54,950 |
| 2013 | $2,258 | $64,995 | $15,050 | $49,945 |
Source: Public Records
Map
Nearby Homes
- 1869 Tewksbury Rd
- 2063 Westover Rd
- 2110 Northwest Blvd
- 2583 Wexford Rd
- 1565 Berkshire Rd
- 1535 Doone Rd
- 1782 Wyandotte Rd
- 1914 Elmwood Ave
- 1733 Elmwood Ave
- 2015 W 5th Ave Unit 211
- 2015 W 5th Ave Unit 102
- 2015 W 5th Ave Unit 108
- 1631 Roxbury Rd Unit F3
- 1631 Roxbury Rd Unit B6
- 2170 Lane Woods Dr Unit 2170
- 1661 Ashland Ave Unit 663
- 1398 Lower Green Cir Unit 1398
- 1561 Glenn Ave
- 1459 Elmwood Ave Unit 1459
- 2754 Scioto Station Dr
- 1991 Suffolk Rd Unit 3
- 1991 Suffolk Rd Unit 2
- 1991 Suffolk Rd Unit 1
- 1991 Suffolk Rd
- 1987 Suffolk Rd Unit 1987
- 1985 Suffolk Rd Unit A1985
- 2164 Arlington Ave Unit 174
- 2164-2174 Arlington Ave
- 1983 Suffolk Rd
- 1981 Suffolk Rd Unit A1981
- 1994 Suffolk Rd
- 1994 Suffolk Rd
- 1994 Suffolk Rd Unit 2
- 1994 Suffolk Rd Unit 3
- 2190 Arlington Ave
- 2160 Arlington Ave Unit 2160
- 2202 Arlington Ave
- 2156 Arlington Ave Unit 2156
- 2152 Arlington Ave Unit 2152
- 2148 Arlington Ave Unit 2148