Estimated Value: $325,000 - $622,000
3
Beds
2
Baths
1,095
Sq Ft
$461/Sq Ft
Est. Value
About This Home
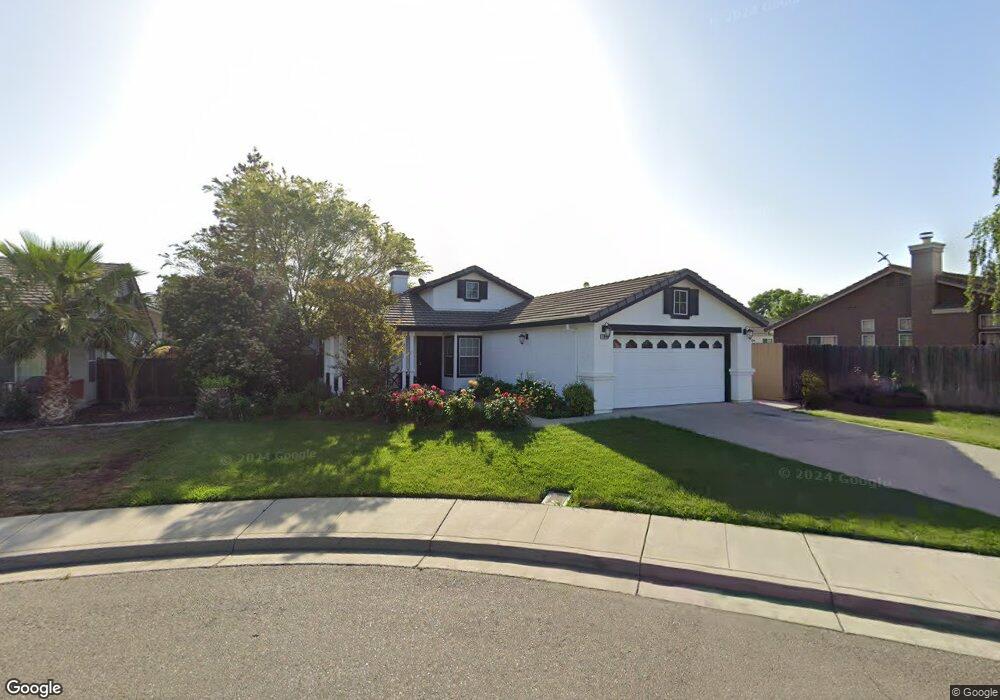
This home is located at 1991 Thomas Dehaven Ct, Tracy, CA 95376 and is currently estimated at $505,263, approximately $461 per square foot. 1991 Thomas Dehaven Ct is a home located in San Joaquin County with nearby schools including Louis J. Villalovoz Elementary School, Earle E. Williams Middle School, and Merrill F. West High School.
Ownership History
Date
Name
Owned For
Owner Type
Purchase Details
Closed on
Jul 20, 2022
Sold by
Oliveira Antonio R and Oliveira Zita M
Bought by
Oliveira Family Trust
Current Estimated Value
Purchase Details
Closed on
Mar 30, 2004
Sold by
Oliveira Antonio R and Oliveira Zita M
Bought by
Oliveira Antonio R and Oliveira Zita M
Home Financials for this Owner
Home Financials are based on the most recent Mortgage that was taken out on this home.
Original Mortgage
$224,000
Interest Rate
5.56%
Mortgage Type
New Conventional
Purchase Details
Closed on
Nov 7, 1993
Sold by
Kaufman & Broad Northern California Inc
Bought by
Oliveira Antonio R and Oliveira Zita M
Home Financials for this Owner
Home Financials are based on the most recent Mortgage that was taken out on this home.
Original Mortgage
$142,706
Interest Rate
6.91%
Mortgage Type
FHA
Create a Home Valuation Report for This Property
The Home Valuation Report is an in-depth analysis detailing your home's value as well as a comparison with similar homes in the area
Home Values in the Area
Average Home Value in this Area
Purchase History
| Date | Buyer | Sale Price | Title Company |
|---|---|---|---|
| Oliveira Family Trust | $15,454 | None Listed On Document | |
| Oliveira Antonio R | -- | Fidelity Natl Title Ins Co | |
| Oliveira Antonio R | $144,500 | First American Title Guarant |
Source: Public Records
Mortgage History
| Date | Status | Borrower | Loan Amount |
|---|---|---|---|
| Previous Owner | Oliveira Antonio R | $224,000 | |
| Previous Owner | Oliveira Antonio R | $142,706 |
Source: Public Records
Tax History
| Year | Tax Paid | Tax Assessment Tax Assessment Total Assessment is a certain percentage of the fair market value that is determined by local assessors to be the total taxable value of land and additions on the property. | Land | Improvement |
|---|---|---|---|---|
| 2025 | $3,006 | $249,286 | $110,453 | $138,833 |
| 2024 | $2,778 | $244,399 | $108,288 | $136,111 |
| 2023 | $2,731 | $239,608 | $106,165 | $133,443 |
| 2022 | $2,673 | $234,911 | $104,084 | $130,827 |
| 2021 | $2,637 | $230,306 | $102,044 | $128,262 |
| 2020 | $2,617 | $227,945 | $100,998 | $126,947 |
| 2019 | $2,572 | $223,476 | $99,018 | $124,458 |
| 2018 | $2,768 | $219,095 | $97,077 | $122,018 |
| 2017 | $2,644 | $214,800 | $95,174 | $119,626 |
| 2016 | $2,661 | $210,588 | $93,308 | $117,280 |
| 2014 | $2,517 | $203,363 | $90,106 | $113,257 |
Source: Public Records
Map
Nearby Homes
- 1990 Harvest Landing Ct
- 2132 Tennis Ln
- 2325 Alamo Ct
- 790 Everglades Ln
- 2432 Tennis Ln
- 2219 Yellowstone Ave
- 50 S Hickory Ave
- 2280 Gibralter Ln
- 1601 Spring Ct
- 2271 Robert Gabriel Dr
- 8300 W 11th St
- 723 Ann Gabriel Ln
- 2228 Carol Ann Dr
- 2431 Garrett Ct
- 481 Keys Ct
- 1745 Parkside Dr
- 925 Colonial Ln
- 2352 Gretchen Elizabeth Ct
- 740 Sequoia Blvd
- 1830 Laurelgrove Ln
- 1999 Thomas Dehaven Ct
- 1931 Thomas Dehaven Ct
- 1921 Thomas Dehaven Ct
- 231 Firefly Way
- 241 Firefly Way
- 1911 Thomas Dehaven Ct
- 1990 Thomas Dehaven Ct
- 1998 Thomas Dehaven Ct
- 1980 Thomas Dehaven Ct
- 1996 Pheasant Run Ct
- 1970 Thomas Dehaven Ct
- 251 Firefly Way
- 1930 Thomas Dehaven Ct
- 1880 Tennis Ln
- 1920 Thomas Dehaven Ct
- 1881 Thomas Dehaven Ln
- 1940 Thomas Dehaven Ct
- 1910 Thomas Dehaven Ct
- 1999 Pheasant Run Ct
- 1960 Thomas Dehaven Ct
Your Personal Tour Guide
Ask me questions while you tour the home.