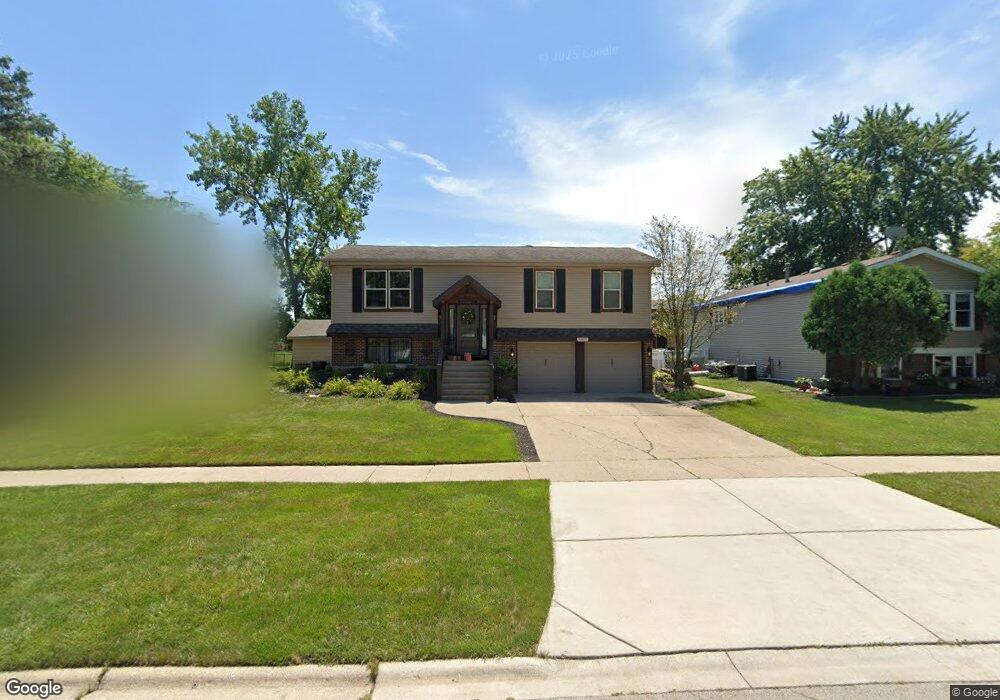
19911 S Pine Hill Rd Frankfort, IL 60423
Frankfort Square NeighborhoodEstimated Value: $322,140 - $334,000
3
Beds
2
Baths
1,215
Sq Ft
$269/Sq Ft
Est. Value
About This Home
This home is located at 19911 S Pine Hill Rd, Frankfort, IL 60423 and is currently estimated at $326,285, approximately $268 per square foot. 19911 S Pine Hill Rd is a home located in Will County with nearby schools including Frankfort Square Elementary School, Walker Intermediate School, and Summit Hill Junior High School.
Ownership History
Date
Name
Owned For
Owner Type
Purchase Details
Closed on
Jun 28, 2024
Sold by
Brooks Deborah A and Brooks Michael A
Bought by
Brooks Michael A and Brooks Deborah A
Current Estimated Value
Home Financials for this Owner
Home Financials are based on the most recent Mortgage that was taken out on this home.
Original Mortgage
$75,000
Outstanding Balance
$74,096
Interest Rate
6.94%
Mortgage Type
New Conventional
Estimated Equity
$252,189
Purchase Details
Closed on
Mar 15, 1996
Sold by
Miner Eric and Miner Karen
Bought by
Brooks Michael A and Taylor Deborah A
Home Financials for this Owner
Home Financials are based on the most recent Mortgage that was taken out on this home.
Original Mortgage
$54,000
Interest Rate
6.98%
Purchase Details
Closed on
Jun 19, 1995
Sold by
Muehlhausen Richard C and Muehlhausen Ellen E
Bought by
Miner Eric and Miner Karen
Home Financials for this Owner
Home Financials are based on the most recent Mortgage that was taken out on this home.
Original Mortgage
$116,500
Interest Rate
7.88%
Mortgage Type
FHA
Create a Home Valuation Report for This Property
The Home Valuation Report is an in-depth analysis detailing your home's value as well as a comparison with similar homes in the area
Home Values in the Area
Average Home Value in this Area
Purchase History
| Date | Buyer | Sale Price | Title Company |
|---|---|---|---|
| Brooks Michael A | -- | National Title Solutions | |
| Brooks Michael A | $117,666 | -- | |
| Miner Eric | $117,500 | -- |
Source: Public Records
Mortgage History
| Date | Status | Borrower | Loan Amount |
|---|---|---|---|
| Open | Brooks Michael A | $75,000 | |
| Previous Owner | Brooks Michael A | $54,000 | |
| Previous Owner | Miner Eric | $116,500 |
Source: Public Records
Tax History
| Year | Tax Paid | Tax Assessment Tax Assessment Total Assessment is a certain percentage of the fair market value that is determined by local assessors to be the total taxable value of land and additions on the property. | Land | Improvement |
|---|---|---|---|---|
| 2024 | $7,252 | $93,979 | $21,018 | $72,961 |
| 2023 | $7,252 | $83,932 | $18,771 | $65,161 |
| 2022 | $6,980 | $76,448 | $17,097 | $59,351 |
| 2021 | $6,019 | $71,520 | $15,995 | $55,525 |
| 2020 | $6,010 | $69,504 | $15,544 | $53,960 |
| 2019 | $5,719 | $67,644 | $15,128 | $52,516 |
| 2018 | $5,504 | $65,699 | $14,693 | $51,006 |
| 2017 | $5,687 | $67,439 | $14,350 | $53,089 |
| 2016 | $5,505 | $65,127 | $13,858 | $51,269 |
| 2015 | $5,150 | $62,834 | $13,370 | $49,464 |
| 2014 | $5,150 | $62,397 | $13,277 | $49,120 |
| 2013 | $5,150 | $63,206 | $13,449 | $49,757 |
Source: Public Records
Map
Nearby Homes
- 20020 S Sycamore Dr
- 20052 S Sycamore Dr
- 20010 S Pine Hill Rd
- 19905 S Mallory Dr
- 7960 W Frankfort Square Rd
- 20116 S Greenfield Ln
- 7907 W Kingston Dr
- 20151 S Rosewood Dr
- 19731 Edgebrook Ln
- 7748 W Harbor Ct Unit 40
- 20301 S Pine Hill Rd Unit 1D
- 8101 Highfield Ct
- 20162 S Fairwood Ct
- 8237 Auburn Ln
- 8256 W Chestnut Ct
- 8548 Monaghan Dr
- 8543 Brookside Glen Dr
- 8021 Enclave Ln
- 8502 Meadows Edge Trail
- 8607 Glenshire St
- 19913 S Pine Hill Rd
- 19909 S Pine Hill Rd
- 19939 S Pine Hill Rd
- 19941 S Thorndale Dr
- 19908 S Pine Hill Rd
- 8061 W Pine Hill Rd
- 19910 S Pine Hill Rd
- 19906 S Pine Hill Rd
- 19915 S Pine Hill Rd
- 19945 S Thorndale Dr
- 19912 S Pine Hill Rd
- 19936 S Sycamore Dr
- 19914 S Pine Hill Rd
- 7981 W Pine Hill Rd
- 19917 S Pine Hill Rd
- 19947 S Thorndale Dr
- 19938 S Sycamore Dr
- 19916 S Pine Hill Rd
- 19960 S Jessica Ln
- 7984 W Pine Hill Rd
Your Personal Tour Guide
Ask me questions while you tour the home.