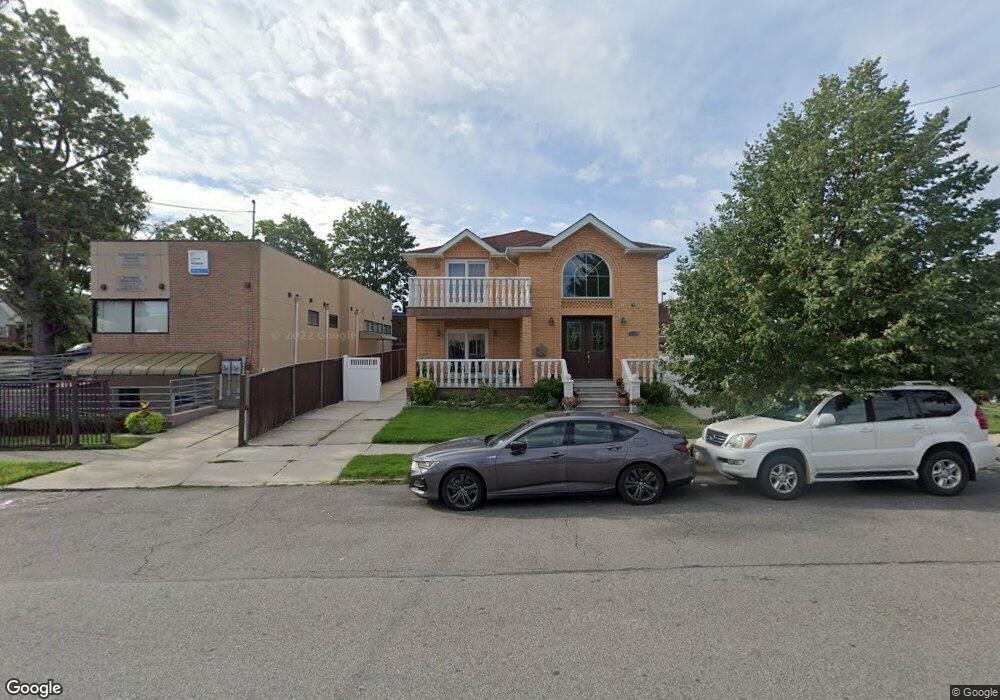
19918 58th Ave Fresh Meadows, NY 11365
Auburndale NeighborhoodEstimated Value: $1,793,000 - $1,931,000
--
Bed
--
Bath
3,224
Sq Ft
$580/Sq Ft
Est. Value
About This Home
This home is located at 19918 58th Ave, Fresh Meadows, NY 11365 and is currently estimated at $1,869,066, approximately $579 per square foot. 19918 58th Ave is a home located in Queens County with nearby schools including P.S. 162 The John Golden School, Nathaniel Hawthorne Middle School 74, and Francis Lewis High School.
Ownership History
Date
Name
Owned For
Owner Type
Purchase Details
Closed on
Nov 18, 2010
Sold by
Chen Min Feng and Xu Xiu Chai
Bought by
Chan Ling Fen and Chan Wing Fong
Current Estimated Value
Home Financials for this Owner
Home Financials are based on the most recent Mortgage that was taken out on this home.
Original Mortgage
$490,000
Outstanding Balance
$322,470
Interest Rate
4.22%
Mortgage Type
Purchase Money Mortgage
Estimated Equity
$1,546,596
Purchase Details
Closed on
Aug 24, 2009
Sold by
Popper Andrew J
Bought by
Chen Min Feng and Xu Xiu Chai
Home Financials for this Owner
Home Financials are based on the most recent Mortgage that was taken out on this home.
Original Mortgage
$390,000
Interest Rate
5.17%
Mortgage Type
Purchase Money Mortgage
Purchase Details
Closed on
Aug 25, 1997
Sold by
Popper Max J
Bought by
Popper Andrew J
Create a Home Valuation Report for This Property
The Home Valuation Report is an in-depth analysis detailing your home's value as well as a comparison with similar homes in the area
Home Values in the Area
Average Home Value in this Area
Purchase History
| Date | Buyer | Sale Price | Title Company |
|---|---|---|---|
| Chan Ling Fen | $988,942 | -- | |
| Chan Ling Fen | $988,942 | -- | |
| Chen Min Feng | $560,000 | -- | |
| Chen Min Feng | $560,000 | -- | |
| Popper Andrew J | -- | Commonwealth Land Title Ins | |
| Popper Andrew J | -- | Commonwealth Land Title Ins |
Source: Public Records
Mortgage History
| Date | Status | Borrower | Loan Amount |
|---|---|---|---|
| Open | Chan Ling Fen | $490,000 | |
| Closed | Chan Ling Fen | $490,000 | |
| Previous Owner | Chen Min Feng | $390,000 |
Source: Public Records
Tax History Compared to Growth
Tax History
| Year | Tax Paid | Tax Assessment Tax Assessment Total Assessment is a certain percentage of the fair market value that is determined by local assessors to be the total taxable value of land and additions on the property. | Land | Improvement |
|---|---|---|---|---|
| 2025 | $14,140 | $75,859 | $11,877 | $63,982 |
| 2024 | $14,152 | $71,801 | $11,383 | $60,418 |
| 2023 | $13,324 | $67,738 | $10,653 | $57,085 |
| 2022 | $9,797 | $101,760 | $18,900 | $82,860 |
| 2021 | $13,778 | $84,360 | $18,900 | $65,460 |
| 2020 | $13,085 | $92,700 | $18,900 | $73,800 |
| 2019 | $12,224 | $83,100 | $18,900 | $64,200 |
| 2018 | $11,209 | $56,448 | $13,122 | $43,326 |
| 2017 | $11,060 | $55,728 | $16,120 | $39,608 |
| 2016 | $10,831 | $55,728 | $16,120 | $39,608 |
| 2015 | $6,121 | $52,680 | $21,000 | $31,680 |
| 2014 | $6,121 | $49,862 | $19,877 | $29,985 |
Source: Public Records
Map
Nearby Homes
- 5640 Francis Lewis Blvd
- 56-39 Francis Lewis Blvd
- 197-20 58th Ave
- 58-39 196th Place
- 198-01 56th Ave
- 53-40 198th St
- 53-12 199th St
- 58-15 Clearview Expy
- 5840 206th St
- 19715 53rd Ave
- 50-15 199th St
- 67-12 197th St Unit 1
- 196-66 67th Ave Unit 1FL
- 58-33 192nd St
- 58-23 192nd St
- 196-54 67th Ave Unit 2
- 4843 201st St
- 6739 197th St
- 48-18 202nd St
- 67-59 197th St
- 199-14 58th Ave
- 19914 58th Ave
- 19914 58th Ave
- 19922 58th Ave
- 5812 Francis Lewis Blvd
- 58-12 Francis Lewis Blvd
- 19910 58th Ave
- 5820 Francis Lewis Blvd
- 19919 58th Ave
- 19915 58th Ave
- 5650 Francis Lewis Blvd
- 19911 58th Ave
- 19907 58th Ave
- 20004 58th Ave
- 20004 58th Ave
- 5807 Francis Lewis Blvd
- 20004 58th Ave
- 199-03 58th Ave
- 19903 58th Ave
- 5811 Francis Lewis Blvd