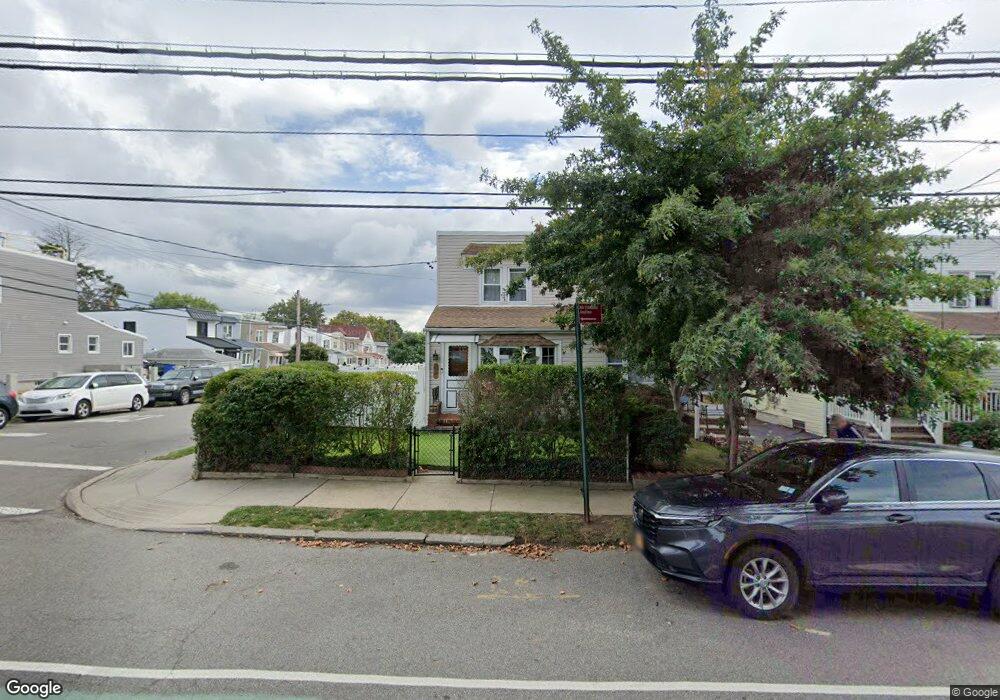
19920 33rd Ave Flushing, NY 11358
Auburndale NeighborhoodEstimated Value: $883,000 - $942,000
Studio
--
Bath
1,080
Sq Ft
$836/Sq Ft
Est. Value
About This Home
This home is located at 19920 33rd Ave, Flushing, NY 11358 and is currently estimated at $902,515, approximately $835 per square foot. 19920 33rd Ave is a home located in Queens County with nearby schools including P.S. 159 Queens, I.S. 25 Adrien Block, and Bayside High School.
Ownership History
Date
Name
Owned For
Owner Type
Purchase Details
Closed on
Oct 11, 2024
Sold by
Kang Miyoung and Kim Jinseop
Bought by
Chang June and Hui Man Kit
Current Estimated Value
Home Financials for this Owner
Home Financials are based on the most recent Mortgage that was taken out on this home.
Original Mortgage
$629,300
Outstanding Balance
$621,047
Interest Rate
6.09%
Mortgage Type
Purchase Money Mortgage
Estimated Equity
$281,468
Purchase Details
Closed on
Sep 30, 2009
Sold by
Frances Kovaciny Revocable Living Trust and Stephen Kovaciny Iii Trustee
Bought by
Kang Miyoung and Kim Jinseop
Home Financials for this Owner
Home Financials are based on the most recent Mortgage that was taken out on this home.
Original Mortgage
$387,000
Interest Rate
5.14%
Mortgage Type
Purchase Money Mortgage
Purchase Details
Closed on
Mar 2, 2004
Sold by
Kovaciny Frances
Bought by
Frances Kovaciny Revocable Living Trust and Kovaciny As Trustee Frances
Create a Home Valuation Report for This Property
The Home Valuation Report is an in-depth analysis detailing your home's value as well as a comparison with similar homes in the area
Home Values in the Area
Average Home Value in this Area
Purchase History
| Date | Buyer | Sale Price | Title Company |
|---|---|---|---|
| Chang June | $899,000 | -- | |
| Chang June | $899,000 | -- | |
| Kang Miyoung | $430,000 | -- | |
| Kang Miyoung | $430,000 | -- | |
| Frances Kovaciny Revocable Living Trust | -- | -- | |
| Frances Kovaciny Revocable Living Trust | -- | -- |
Source: Public Records
Mortgage History
| Date | Status | Borrower | Loan Amount |
|---|---|---|---|
| Open | Chang June | $629,300 | |
| Closed | Chang June | $629,300 | |
| Previous Owner | Kang Miyoung | $387,000 |
Source: Public Records
Tax History
| Year | Tax Paid | Tax Assessment Tax Assessment Total Assessment is a certain percentage of the fair market value that is determined by local assessors to be the total taxable value of land and additions on the property. | Land | Improvement |
|---|---|---|---|---|
| 2025 | $5,613 | $28,878 | $6,611 | $22,267 |
| 2024 | $5,613 | $27,946 | $7,116 | $20,830 |
| 2023 | $5,354 | $26,656 | $6,289 | $20,367 |
| 2022 | $5,064 | $48,540 | $11,580 | $36,960 |
| 2021 | $5,066 | $48,660 | $11,580 | $37,080 |
| 2020 | $5,094 | $43,320 | $11,580 | $31,740 |
| 2019 | $4,872 | $41,940 | $11,580 | $30,360 |
| 2018 | $4,528 | $22,213 | $6,277 | $15,936 |
| 2017 | $4,309 | $21,139 | $7,157 | $13,982 |
| 2016 | $4,011 | $21,139 | $7,157 | $13,982 |
| 2015 | $1,603 | $20,054 | $8,143 | $11,911 |
| 2014 | $1,603 | $19,407 | $8,510 | $10,897 |
Source: Public Records
Map
Nearby Homes
- 32-28 202nd St
- 20206 33rd Ave
- 3227 202nd St
- 200-14 34th Ave
- 34-12 192nd St
- 3314 204th St
- 3226 204th St
- 204-11 34th Ave
- 3228 Utopia Pkwy
- 34-32 205th St
- 35-05 204th St Unit 245
- 205-12 34th Ave
- 204-12 35th Ave Unit 254
- 35-27 203rd St
- 36-20 194th St Unit 3r
- 35-12 205th St Unit 259
- 3617 194th St
- 28-07 172nd St
- 201-05 28th Ave
- 207-01 34th Ave
- 19918 33rd Ave
- 199-20 33rd Ave
- 19916 33rd Ave
- 199-16 33rd Ave
- 19914 33rd Ave
- 199-14 33rd Ave
- 19914 33rd Ave
- 3312 200th St
- 3312 200th St
- 20002 33rd Ave
- 200-02 33rd Ave
- 19912 33rd Ave
- 199-12 33rd Ave
- 3314 200th St
- 20004 33rd Ave
- 19910 33rd Ave
- 3316 200th St
- 20006 33rd Ave
- 33-11 200th St
- 19908 33rd Ave
Your Personal Tour Guide
Ask me questions while you tour the home.