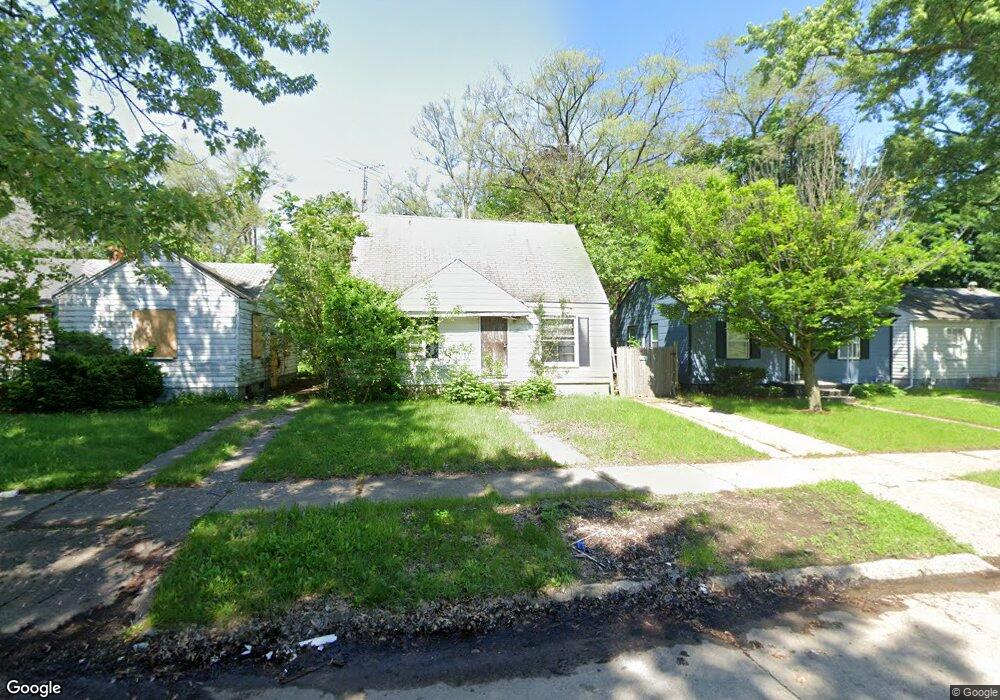
19939 Fenmore St Detroit, MI 48235
Greenfield NeighborhoodEstimated Value: $69,000 - $76,588
--
Bed
1
Bath
716
Sq Ft
$103/Sq Ft
Est. Value
About This Home
This home is located at 19939 Fenmore St, Detroit, MI 48235 and is currently estimated at $73,647, approximately $102 per square foot. 19939 Fenmore St is a home located in Wayne County with nearby schools including Bow Elementary-Middle School, Charles L. Spain Elementary-Middle School, and Edward 'Duke' Ellington Conservatory of Music and Art.
Ownership History
Date
Name
Owned For
Owner Type
Purchase Details
Closed on
Apr 15, 2020
Sold by
Jvs Management Group Llc
Bought by
Amarras Investments Llc
Current Estimated Value
Purchase Details
Closed on
Dec 1, 2017
Sold by
Sabree Eric R
Bought by
Jvs Mangement Group Llc
Purchase Details
Closed on
Nov 11, 2014
Sold by
Treasurer Of The Charter County Of Wayne
Bought by
Bruce Anthony A
Purchase Details
Closed on
Nov 29, 2010
Sold by
Wojtowicz Raymond J
Bought by
Brownie Brink Llc
Create a Home Valuation Report for This Property
The Home Valuation Report is an in-depth analysis detailing your home's value as well as a comparison with similar homes in the area
Home Values in the Area
Average Home Value in this Area
Purchase History
| Date | Buyer | Sale Price | Title Company |
|---|---|---|---|
| Amarras Investments Llc | $7,720 | None Available | |
| Jvs Mangement Group Llc | $4,415 | None Available | |
| Bruce Anthony A | $2,800 | None Available | |
| Brownie Brink Llc | $1,000 | None Available |
Source: Public Records
Tax History Compared to Growth
Tax History
| Year | Tax Paid | Tax Assessment Tax Assessment Total Assessment is a certain percentage of the fair market value that is determined by local assessors to be the total taxable value of land and additions on the property. | Land | Improvement |
|---|---|---|---|---|
| 2025 | $1,142 | $22,700 | $0 | $0 |
| 2024 | $1,142 | $20,000 | $0 | $0 |
| 2023 | $1,108 | $15,900 | $0 | $0 |
| 2022 | $1,179 | $13,100 | $0 | $0 |
| 2021 | $1,148 | $10,400 | $0 | $0 |
| 2020 | $831 | $9,600 | $0 | $0 |
| 2019 | $820 | $7,900 | $0 | $0 |
| 2018 | $733 | $6,400 | $0 | $0 |
| 2017 | $114 | $6,000 | $0 | $0 |
| 2016 | $952 | $9,400 | $0 | $0 |
| 2015 | $940 | $9,400 | $0 | $0 |
| 2013 | $1,317 | $13,171 | $0 | $0 |
| 2010 | -- | $18,872 | $856 | $18,016 |
Source: Public Records
Map
Nearby Homes
- 20004 Southfield Fwy
- 20014 Southfield Rd
- 19925 Archdale St
- 19765 Archdale St
- 18231 Pembroke Ave
- 20052 Archdale St
- 20051 Oakfield St
- 19950 Oakfield St
- 19731 Harlow St
- 19781 Oakfield St
- 20220 Ashton Ave
- 20201 Ashton Ave
- 19751 Oakfield St
- 20210 Archdale St
- 19786 Oakfield St
- 20245 Archdale St
- 19780 Oakfield St
- 19940 Faust Ave
- 19433 Fenmore St
- 19425 Fenmore St
- 19935 Fenmore St
- 19945 Fenmore St
- 19929 Fenmore St
- 19951 Fenmore St
- 19925 Fenmore St
- 19957 Fenmore St
- 19940 Southfield Fwy
- 19934 Southfield Fwy
- 19944 Southfield Fwy
- 19928 Southfield Fwy
- 19950 Southfield Fwy
- 19961 Fenmore St
- 19919 Fenmore St
- 19922 Southfield Fwy
- 19956 Southfield Fwy
- 19934 Fenmore St
- 19944 Fenmore St
- 19950 Southfield Rd
- 19918 Southfield Fwy
- 19967 Fenmore St