
Landlord's Agent in 2016
Katie Bickham
eXp Realty
(708) 738-2306
19 Total Sales

Estimated Value: $228,000 - $260,214
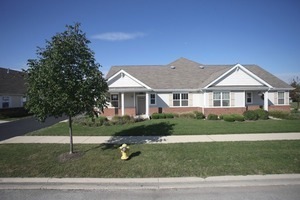
This home is located at 19948 Burnside Ct, Olympia Fields, IL 60461 since 19 July 2016 and is currently priced at $247,304. This property was built in 2005. 19948 Burnside Ct is a home located in Cook County with nearby schools including Illinois School, Arcadia Elementary School, and Indiana Elementary School.
| Date | Buyer | Sale Price | Title Company |
|---|---|---|---|
| Collins Walter | $130,000 | Attorneys Title Guaranty Fun | |
| Richey Johnnye | $102,000 | Baird & Warner Title Service |
| Date | Status | Borrower | Loan Amount |
|---|---|---|---|
| Open | Collins Walter | $134,290 | |
| Previous Owner | Richey Johnnye | $153,000 |
| Date | Event | Price | List to Sale | Price per Sq Ft |
|---|---|---|---|---|
| 07/19/2016 07/19/16 | For Rent | $1,400 | 0.0% | -- |
| 07/19/2016 07/19/16 | Rented | $1,400 | -- | -- |
| Year | Tax Paid | Tax Assessment Tax Assessment Total Assessment is a certain percentage of the fair market value that is determined by local assessors to be the total taxable value of land and additions on the property. | Land | Improvement |
|---|---|---|---|---|
| 2025 | $3,337 | $19,000 | $497 | $18,503 |
| 2024 | $3,337 | $19,000 | $497 | $18,503 |
| 2023 | $4,493 | $19,000 | $497 | $18,503 |
| 2022 | $4,493 | $15,164 | $894 | $14,270 |
| 2021 | $4,342 | $15,164 | $894 | $14,270 |
| 2020 | $3,697 | $15,164 | $894 | $14,270 |
| 2019 | $4,157 | $18,140 | $795 | $17,345 |
| 2018 | $4,135 | $18,140 | $795 | $17,345 |
| 2017 | $6,730 | $19,455 | $795 | $18,660 |
| 2016 | $5,591 | $15,414 | $695 | $14,719 |
| 2015 | $5,465 | $15,414 | $695 | $14,719 |
| 2014 | $5,387 | $15,414 | $695 | $14,719 |
| 2013 | $5,533 | $16,905 | $695 | $16,210 |
Landlord's Agent in 2016
Katie Bickham
eXp Realty
(708) 738-2306
19 Total Sales
Source: Midwest Real Estate Data (MRED)
MLS Number: MRD09294917
APN: 31-14-104-055-0000
Disclaimer: Certain information contained herein is derived from information provided by parties other than Homes.com. All information provided is deemed reliable, but is not guaranteed to be accurate and should be independently verified.
![]() Based on information submitted to the MLS GRID. All data is obtained from various sources and may not have been verified by broker or MLS GRID. Supplied Open House Information is subject to change without notice. All information should be independently reviewed and verified for accuracy. Properties may or may not be listed by the office/agent presenting the information. Some IDX listings have been excluded from this website.
Based on information submitted to the MLS GRID. All data is obtained from various sources and may not have been verified by broker or MLS GRID. Supplied Open House Information is subject to change without notice. All information should be independently reviewed and verified for accuracy. Properties may or may not be listed by the office/agent presenting the information. Some IDX listings have been excluded from this website.
Based on information submitted to the MLS GRID
Ask me questions while you tour the home.