Estimated Value: $316,884 - $401,000
6
Beds
4
Baths
3,136
Sq Ft
$115/Sq Ft
Est. Value
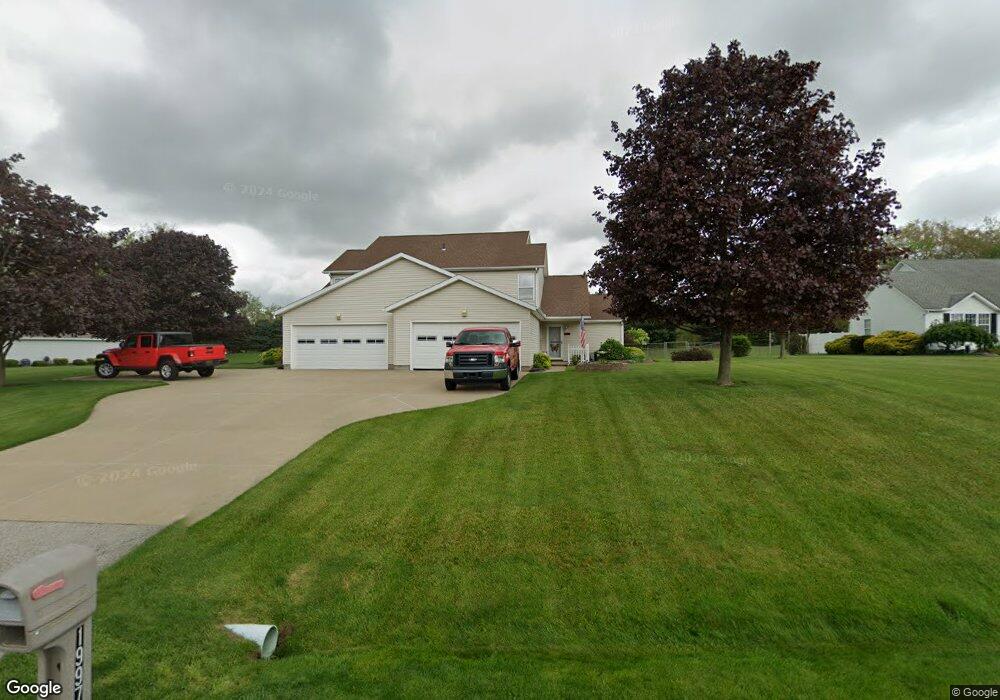
About This Home
This home is located at 1995 Rolling Meadows Ln Unit 1997, Akron, OH 44312 and is currently estimated at $360,971, approximately $115 per square foot. 1995 Rolling Meadows Ln Unit 1997 is a home located in Summit County with nearby schools including Springfield High School, Chapel Hill Christian School-Green Campus, and Academy of the Immaculate Heart of Mary.
Ownership History
Date
Name
Owned For
Owner Type
Purchase Details
Closed on
Mar 3, 2021
Sold by
Bever Kenneth B and Bever Brenda
Bought by
Rlt 1997 Rolling Meadows Lane
Current Estimated Value
Purchase Details
Closed on
Feb 16, 1999
Sold by
Krummel Catherine M
Bought by
Bever Kenneth B and Bever Brenda Lea
Home Financials for this Owner
Home Financials are based on the most recent Mortgage that was taken out on this home.
Original Mortgage
$144,400
Interest Rate
6.88%
Mortgage Type
Purchase Money Mortgage
Purchase Details
Closed on
Nov 6, 1997
Sold by
Decath Dev Inc
Bought by
Krummel Catherine M
Create a Home Valuation Report for This Property
The Home Valuation Report is an in-depth analysis detailing your home's value as well as a comparison with similar homes in the area
Purchase History
| Date | Buyer | Sale Price | Title Company |
|---|---|---|---|
| Rlt 1997 Rolling Meadows Lane | -- | None Available | |
| Bever Kenneth B | $160,485 | Kent Title Agency Inc | |
| Krummel Catherine M | $35,000 | -- |
Source: Public Records
Mortgage History
| Date | Status | Borrower | Loan Amount |
|---|---|---|---|
| Previous Owner | Bever Kenneth B | $144,400 |
Source: Public Records
Tax History
| Year | Tax Paid | Tax Assessment Tax Assessment Total Assessment is a certain percentage of the fair market value that is determined by local assessors to be the total taxable value of land and additions on the property. | Land | Improvement |
|---|---|---|---|---|
| 2025 | $3,823 | $77,379 | $20,332 | $57,047 |
| 2024 | $3,823 | $77,379 | $20,332 | $57,047 |
| 2023 | $3,823 | $77,379 | $20,332 | $57,047 |
| 2022 | $3,197 | $58,066 | $15,173 | $42,893 |
| 2021 | $3,125 | $58,066 | $15,173 | $42,893 |
| 2020 | $3,081 | $58,060 | $15,170 | $42,890 |
| 2019 | $3,282 | $57,460 | $14,420 | $43,040 |
| 2018 | $3,153 | $57,460 | $14,420 | $43,040 |
| 2017 | $3,282 | $57,460 | $14,420 | $43,040 |
| 2016 | $3,313 | $57,460 | $14,420 | $43,040 |
| 2015 | $3,282 | $57,460 | $14,420 | $43,040 |
| 2014 | $3,242 | $57,460 | $14,420 | $43,040 |
| 2013 | $3,157 | $55,970 | $14,420 | $41,550 |
Source: Public Records
Map
Nearby Homes
- 2690 Mayfair Rd
- 1702 Far View Rd
- 2575 Myersville Rd
- 2928 Pressler Rd
- 1724 Krumroy Rd
- 1731 Berger Rd
- 1899 Edwards Dr
- 2248 Hi Vue Dr
- 2020 Myersville Rd
- 2190 Waterbury Dr
- 2837 Stratford Cir
- 1888 Myersville Rd
- 1254 Maxfli Dr
- 1238 Maxfli Dr
- 1821 Myersville Rd
- 1088 Buena Vista Dr
- 1457 5th Ave
- 1532 Cove Ave
- 1554 Woods Rd
- 3225 Imrek Dr
- 2003 Rolling Meadows Ln Unit 2005
- 1989 Rolling Meadows Ln
- 2430 Meadow Spring Cir
- 1996 Rolling Meadows Ln Unit 1998
- 1998 Rolling Meadows Ln
- 2428 Meadow Spring Cir Unit 2430
- 2011 Rolling Meadows Ln Unit 2013
- 1981 Rolling Meadows Ln
- 2012 Rolling Meadows Ln Unit 2014
- 2012 Rolling Meadows Ln
- 2012 2014 Rolling Meadows Ln
- 1988 Rolling Meadows Ln Unit 1990
- 2427 Meadow Spring Cir Unit 2429
- 2019 Rolling Meadows Ln Unit 2021
- 2404 Meadow Spring Cir Unit 2406
- 2419 Meadow Spring Cir Unit 2421
- 1982 Rolling Meadows Ln
- 2020 Rolling Meadows Ln Unit 2022
- 2020 2022 Rolling Meadows Ln
- 2029 Rolling Meadows Ln
Your Personal Tour Guide
Ask me questions while you tour the home.