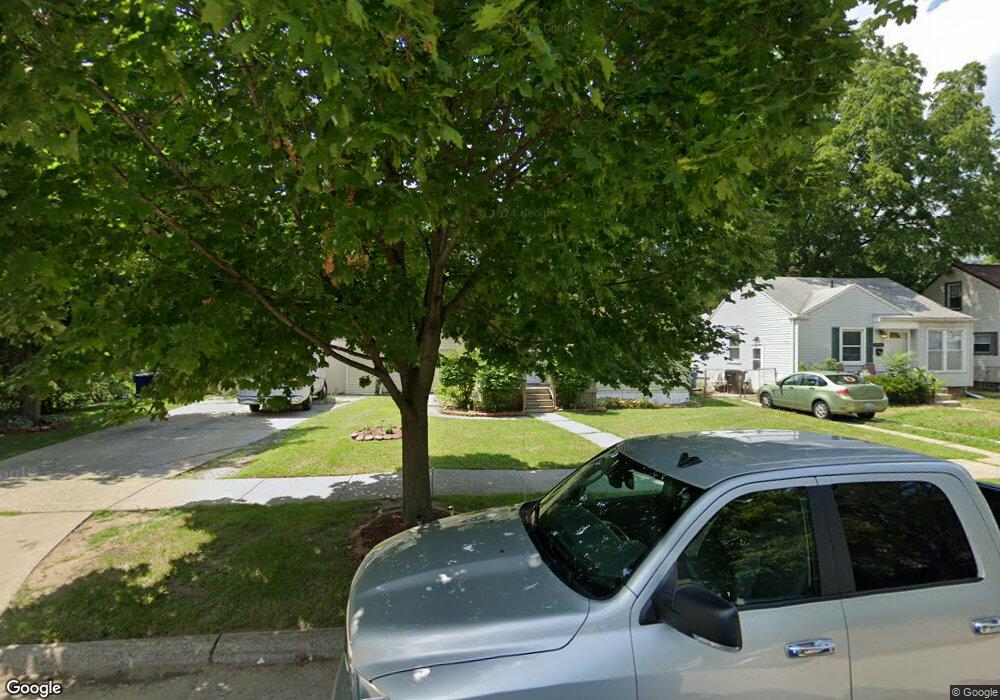
19953 Centralia Redford, MI 48240
Estimated Value: $159,000 - $177,000
3
Beds
1
Bath
1,183
Sq Ft
$144/Sq Ft
Est. Value
About This Home
This home is located at 19953 Centralia, Redford, MI 48240 and is currently estimated at $170,481, approximately $144 per square foot. 19953 Centralia is a home located in Wayne County with nearby schools including Beech Elementary School, Hilbert Middle School, and Redford Union High School.
Ownership History
Date
Name
Owned For
Owner Type
Purchase Details
Closed on
Dec 15, 2017
Sold by
Star Robert E and Star Rosemarie
Bought by
Star Robert E
Current Estimated Value
Purchase Details
Closed on
Apr 26, 2013
Sold by
Smith Laureen and Williams Estral E
Bought by
Star Robert E and Star Rose Marie
Purchase Details
Closed on
Jul 14, 2005
Sold by
Jacobs Dianne
Bought by
Smith Laureen
Purchase Details
Closed on
Oct 2, 1996
Sold by
Haye Michael P and Haye Theresa
Bought by
Dianne Jacobs
Create a Home Valuation Report for This Property
The Home Valuation Report is an in-depth analysis detailing your home's value as well as a comparison with similar homes in the area
Home Values in the Area
Average Home Value in this Area
Purchase History
| Date | Buyer | Sale Price | Title Company |
|---|---|---|---|
| Star Robert E | -- | None Available | |
| Star Robert E | $35,000 | Capital Title Ins Agency | |
| Smith Laureen | $129,900 | First American Title | |
| Dianne Jacobs | $80,000 | -- |
Source: Public Records
Tax History Compared to Growth
Tax History
| Year | Tax Paid | Tax Assessment Tax Assessment Total Assessment is a certain percentage of the fair market value that is determined by local assessors to be the total taxable value of land and additions on the property. | Land | Improvement |
|---|---|---|---|---|
| 2025 | $783 | $88,300 | $0 | $0 |
| 2024 | $783 | $81,600 | $0 | $0 |
| 2023 | $747 | $69,100 | $0 | $0 |
| 2022 | $1,870 | $58,300 | $0 | $0 |
| 2021 | $1,818 | $55,200 | $0 | $0 |
| 2020 | $1,793 | $46,600 | $0 | $0 |
| 2019 | $1,755 | $39,100 | $0 | $0 |
| 2018 | $673 | $32,300 | $0 | $0 |
| 2017 | $1,737 | $29,900 | $0 | $0 |
| 2016 | $1,527 | $29,300 | $0 | $0 |
| 2015 | $2,418 | $26,400 | $0 | $0 |
| 2013 | $2,430 | $25,200 | $0 | $0 |
| 2012 | $1,690 | $29,000 | $9,200 | $19,800 |
Source: Public Records
Map
Nearby Homes
- 19958 Norborne
- 19946 Kinloch
- 19941 Woodworth
- 20005 Woodworth
- 19765 Sumner
- 20492 Wakenden
- 20501 Centralia
- 20501 Wakenden
- 19551 Imperial Hwy
- 19944 Lennane
- 20504 Kinloch
- 19550 Imperial Hwy
- 19336 Centralia
- 20540 Woodworth
- 19394 Woodworth
- 19495 Lexington
- 19991 Garfield
- 19430 Lexington
- 20531 Lennane
- 19347 Woodworth
- 19931 Centralia
- 19961 Centralia
- VAC Centralia
- 19923 Centralia
- 19969 Centralia
- 19950 Norborne
- 19944 Norborne
- 19934 Norborne
- 19977 Centralia
- 19917 Centralia
- 19948 Centralia
- 19940 Centralia
- 19954 Centralia
- 19932 Centralia
- 19962 Centralia
- 19924 Centralia Unit Bldg-Unit
- 19924 Centralia
- 19983 Centralia
- 19909 Centralia
- 19970 Centralia