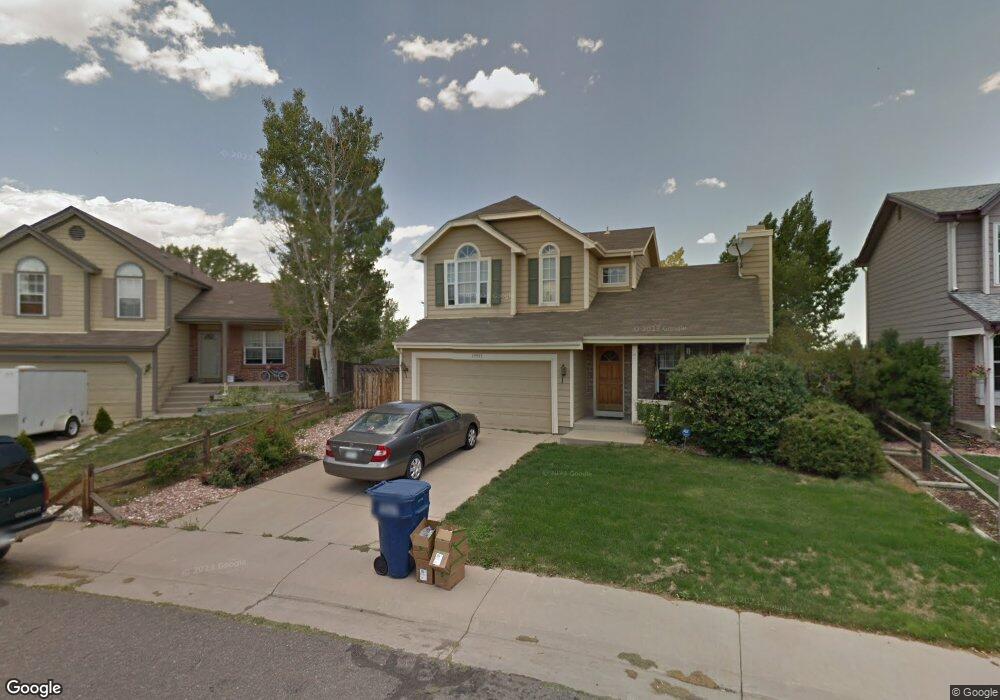
19955 E Oberlin Place Aurora, CO 80013
Highpoint NeighborhoodEstimated Value: $420,190 - $465,000
3
Beds
4
Baths
1,228
Sq Ft
$366/Sq Ft
Est. Value
About This Home
This home is located at 19955 E Oberlin Place, Aurora, CO 80013 and is currently estimated at $449,298, approximately $365 per square foot. 19955 E Oberlin Place is a home located in Arapahoe County with nearby schools including Sunrise Elementary School, Horizon Middle School, and Smoky Hill High School.
Ownership History
Date
Name
Owned For
Owner Type
Purchase Details
Closed on
Oct 17, 1997
Sold by
Crader Cody
Bought by
Gililland Robert and Gililland Cari
Current Estimated Value
Home Financials for this Owner
Home Financials are based on the most recent Mortgage that was taken out on this home.
Original Mortgage
$131,950
Outstanding Balance
$18,942
Interest Rate
7.52%
Mortgage Type
FHA
Estimated Equity
$430,356
Purchase Details
Closed on
May 29, 1992
Sold by
Muller James M Muller Sherry A
Bought by
Crader Cody
Purchase Details
Closed on
Oct 30, 1987
Sold by
Columbine Homes Inc
Bought by
Muller James M Muller Sherry A
Purchase Details
Closed on
Apr 30, 1987
Sold by
Conversion Arapco
Bought by
Columbine Homes Inc
Purchase Details
Closed on
Nov 1, 1985
Sold by
Conversion Arapco
Bought by
Conversion Arapco
Purchase Details
Closed on
Apr 27, 1983
Bought by
Conversion Arapco
Create a Home Valuation Report for This Property
The Home Valuation Report is an in-depth analysis detailing your home's value as well as a comparison with similar homes in the area
Home Values in the Area
Average Home Value in this Area
Purchase History
| Date | Buyer | Sale Price | Title Company |
|---|---|---|---|
| Gililland Robert | $133,900 | -- | |
| Crader Cody | -- | -- | |
| Muller James M Muller Sherry A | -- | -- | |
| Columbine Homes Inc | -- | -- | |
| Conversion Arapco | -- | -- | |
| Conversion Arapco | -- | -- |
Source: Public Records
Mortgage History
| Date | Status | Borrower | Loan Amount |
|---|---|---|---|
| Open | Gililland Robert | $131,950 |
Source: Public Records
Tax History
| Year | Tax Paid | Tax Assessment Tax Assessment Total Assessment is a certain percentage of the fair market value that is determined by local assessors to be the total taxable value of land and additions on the property. | Land | Improvement |
|---|---|---|---|---|
| 2025 | $2,605 | $30,087 | -- | -- |
| 2024 | $2,297 | $33,199 | -- | -- |
| 2023 | $2,297 | $33,199 | $0 | $0 |
| 2022 | $2,025 | $27,960 | $0 | $0 |
| 2021 | $2,038 | $27,960 | $0 | $0 |
| 2020 | $1,801 | $25,075 | $0 | $0 |
| 2019 | $1,737 | $25,075 | $0 | $0 |
| 2018 | $1,609 | $21,823 | $0 | $0 |
| 2017 | $1,586 | $21,823 | $0 | $0 |
| 2016 | $1,358 | $17,528 | $0 | $0 |
| 2015 | $1,292 | $17,528 | $0 | $0 |
| 2014 | -- | $12,999 | $0 | $0 |
| 2013 | -- | $13,990 | $0 | $0 |
Source: Public Records
Map
Nearby Homes
- 4206 S Halifax Way
- 4240 S Ireland St
- 4241 S Fundy Way
- 3843 S Gibraltar St
- 19554 E Princeton Place
- 20480 E Mansfield Ave
- 4353 S Himalaya Ct
- 3770 S Genoa Cir Unit D
- 20656 E Oxford Place
- 4363 S Genoa Ct
- 3752 S Genoa Cir Unit B
- 19462 E Milan Cir
- 4152 S Dunkirk Way
- 19585 E Sunset Cir
- 19562 E Sunset Cir
- 19518 E Sunset Cir
- 3742 S Ensenada St
- 3817 S Ceylon Way
- 4460 S Ensenada St
- 18967 E Mercer Dr
- 19963 E Oberlin Place
- 19953 E Oberlin Place
- 19973 E Oberlin Place
- 19954 E Oberlin Place
- 19943 E Oberlin Place
- 19944 E Oberlin Place
- 19983 E Oberlin Place
- 19964 E Oberlin Place
- 19933 E Oberlin Place
- 19974 E Oberlin Place
- 19993 E Oberlin Place
- 4200 S Halifax Way
- 19923 E Oberlin Place
- 4202 S Halifax Way
- 4204 S Halifax Way
- 19995 E Oberlin Place
- 19984 E Oberlin Place
- 19915 E Oberlin Place
- 19994 E Oberlin Place
- 19913 E Oberlin Place
Your Personal Tour Guide
Ask me questions while you tour the home.