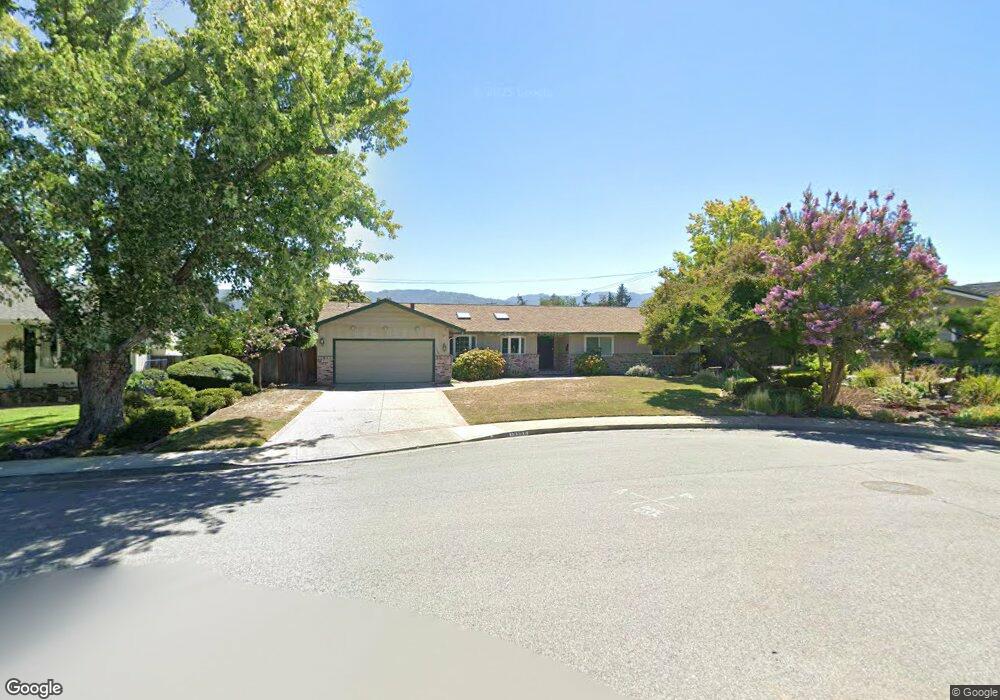
19968 Charters Ave Saratoga, CA 95070
The Golden Triangle NeighborhoodEstimated Value: $3,789,051 - $4,733,000
4
Beds
3
Baths
2,362
Sq Ft
$1,818/Sq Ft
Est. Value
About This Home
This home is located at 19968 Charters Ave, Saratoga, CA 95070 and is currently estimated at $4,295,013, approximately $1,818 per square foot. 19968 Charters Ave is a home located in Santa Clara County with nearby schools including Argonaut Elementary School, Foothill Elementary School, and Saratoga Elementary School.
Ownership History
Date
Name
Owned For
Owner Type
Purchase Details
Closed on
Aug 10, 2016
Sold by
Sloan Jerry F
Bought by
Sloan Jerry F
Current Estimated Value
Purchase Details
Closed on
Apr 26, 1995
Sold by
Sloan Jerry F and Sloan Dianne B
Bought by
Sloan Dianne B and Sloan Jerry F
Create a Home Valuation Report for This Property
The Home Valuation Report is an in-depth analysis detailing your home's value as well as a comparison with similar homes in the area
Home Values in the Area
Average Home Value in this Area
Purchase History
| Date | Buyer | Sale Price | Title Company |
|---|---|---|---|
| Sloan Jerry F | -- | None Available | |
| Sloan Dianne B | -- | -- |
Source: Public Records
Tax History Compared to Growth
Tax History
| Year | Tax Paid | Tax Assessment Tax Assessment Total Assessment is a certain percentage of the fair market value that is determined by local assessors to be the total taxable value of land and additions on the property. | Land | Improvement |
|---|---|---|---|---|
| 2025 | $3,070 | $185,019 | $48,942 | $136,077 |
| 2024 | $3,070 | $181,392 | $47,983 | $133,409 |
| 2023 | $2,980 | $177,837 | $47,043 | $130,794 |
| 2022 | $2,901 | $174,351 | $46,121 | $128,230 |
| 2021 | $2,829 | $170,933 | $45,217 | $125,716 |
| 2020 | $2,752 | $169,181 | $44,754 | $124,427 |
| 2019 | $2,689 | $165,865 | $43,877 | $121,988 |
| 2018 | $2,624 | $162,614 | $43,017 | $119,597 |
| 2017 | $2,587 | $159,426 | $42,174 | $117,252 |
| 2016 | $2,478 | $156,301 | $41,348 | $114,953 |
| 2015 | $2,402 | $153,954 | $40,727 | $113,227 |
| 2014 | $2,326 | $150,940 | $39,930 | $111,010 |
Source: Public Records
Map
Nearby Homes
- 20077 Ljepava Dr
- 19662 Via Grande Dr
- 12790 Glen Arbor Ct
- 19522 Via Real Dr
- 13010 Glen Brae Dr
- 20410 Thelma Ave
- 19938 Baroni Ct
- 19437 Via Real Dr
- 13845 Saratoga Ave
- 19423 Vineyard Ln
- 19113 Vineyard Ln
- 20557 Deerpark Ct
- 20460 Williams Ave
- 14231 Juniper Ln
- 19920 Viewridge Dr
- 14275 Saratoga Ave
- 13550 Myren Dr
- 18396 Mill Ct
- 14333 Saratoga Ave Unit 14
- 19825 Douglass Ln
- 19970 Charters Ave
- 19956 Charters Ave
- 19999 Angus Ct
- 19981 Angus Ct
- 19947 Charters Ave
- 19982 Charters Ct
- 19944 Charters Ave
- 19990 Angus Ct
- 19961 Angus Ct
- 19939 Charters Ave
- 19980 Angus Ct
- 19932 Charters Ave
- 19988 Charters Ct
- 19941 Angus Ct
- 19935 Charters Ave
- 20000 Charters Ct
- 19960 Angus Ct
- 20011 Glasgow Dr
- 20012 Charters Ct
- 20029 Glasgow Dr