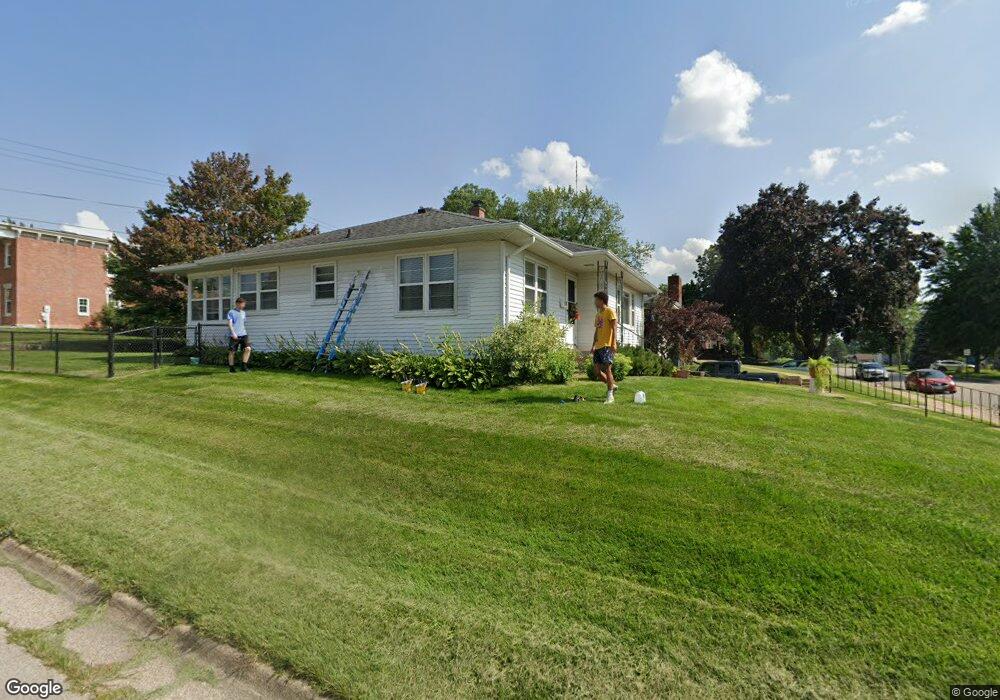
1998 Chaney Rd Dubuque, IA 52001
Estimated Value: $198,511 - $215,000
2
Beds
1
Bath
1,186
Sq Ft
$175/Sq Ft
Est. Value
About This Home
This home is located at 1998 Chaney Rd, Dubuque, IA 52001 and is currently estimated at $207,878, approximately $175 per square foot. 1998 Chaney Rd is a home located in Dubuque County with nearby schools including Irving Elementary School, George Washington Middle School, and Dubuque Senior High School.
Ownership History
Date
Name
Owned For
Owner Type
Purchase Details
Closed on
Apr 27, 2007
Sold by
Powers Jeffrey J and Powers Ronda L
Bought by
Herbst Mary Ellen
Current Estimated Value
Home Financials for this Owner
Home Financials are based on the most recent Mortgage that was taken out on this home.
Original Mortgage
$75,000
Outstanding Balance
$45,422
Interest Rate
6.18%
Mortgage Type
New Conventional
Estimated Equity
$162,456
Purchase Details
Closed on
Jun 22, 2006
Sold by
Wolter Danie J and Wolter Stephen S
Bought by
Powers Jeffrey J and Powers Ronda L
Home Financials for this Owner
Home Financials are based on the most recent Mortgage that was taken out on this home.
Original Mortgage
$97,520
Interest Rate
6.68%
Mortgage Type
New Conventional
Purchase Details
Closed on
Aug 18, 2005
Sold by
Fecker Gus
Bought by
Wolter Daniel J and Wolter Stephanie
Home Financials for this Owner
Home Financials are based on the most recent Mortgage that was taken out on this home.
Original Mortgage
$88,000
Interest Rate
5.93%
Mortgage Type
New Conventional
Create a Home Valuation Report for This Property
The Home Valuation Report is an in-depth analysis detailing your home's value as well as a comparison with similar homes in the area
Purchase History
| Date | Buyer | Sale Price | Title Company |
|---|---|---|---|
| Herbst Mary Ellen | $118,500 | None Available | |
| Powers Jeffrey J | $122,000 | None Available | |
| Wolter Daniel J | $110,000 | None Available |
Source: Public Records
Mortgage History
| Date | Status | Borrower | Loan Amount |
|---|---|---|---|
| Open | Herbst Mary Ellen | $75,000 | |
| Previous Owner | Powers Jeffrey J | $97,520 | |
| Previous Owner | Wolter Daniel J | $88,000 |
Source: Public Records
Tax History
| Year | Tax Paid | Tax Assessment Tax Assessment Total Assessment is a certain percentage of the fair market value that is determined by local assessors to be the total taxable value of land and additions on the property. | Land | Improvement |
|---|---|---|---|---|
| 2025 | $2,022 | $186,500 | $39,300 | $147,200 |
| 2024 | $2,022 | $164,600 | $35,600 | $129,000 |
| 2023 | $2,054 | $164,600 | $35,600 | $129,000 |
| 2022 | $2,106 | $136,360 | $33,710 | $102,650 |
| 2021 | $2,106 | $136,360 | $33,710 | $102,650 |
| 2020 | $2,046 | $123,870 | $31,830 | $92,040 |
| 2019 | $2,074 | $123,870 | $31,830 | $92,040 |
| 2018 | $2,038 | $120,050 | $29,960 | $90,090 |
| 2017 | $2,024 | $120,050 | $29,960 | $90,090 |
| 2016 | $1,980 | $113,340 | $29,960 | $83,380 |
| 2015 | $1,980 | $113,340 | $29,960 | $83,380 |
| 2014 | $1,896 | $111,700 | $29,960 | $81,740 |
Source: Public Records
Map
Nearby Homes
- 2035 Broadlawn Rd
- 2935 Saint Anne Dr
- 2185 Broadlawn Rd
- 2995 Asbury Rd
- 2935 Van Buren St
- 3154 Erie Ct
- 2466 Cherry St
- 2685 Renaissance Dr
- 2281 Pasadena Dr
- 2290 Theda Dr
- 3085 Lindale St
- 2315 Pasadena Dr
- 2315 Pasadena Dr
- 2155 Decorah St
- 3085 Kaufmann Ave
- 1600 Lori St
- 2930 Kane #1 St
- 2548 Marywood Dr
- 2628 University Ave
- 2201 Del Monaco Dr
- 1990 Chaney Rd
- 2002 Chaney Rd
- 1980 Chaney Rd
- 2615 Hillcrest Rd
- 2615 Hillcrest Rd
- 2014 Chaney Rd
- 1995 Chaney Rd
- 2005 Ogilby Rd
- 1970 Chaney Rd
- 2015 Ogilby Rd
- 2003 Chaney Rd
- 2028 Chaney Rd
- 1985 Chaney Rd
- 2725 Hillcrest Rd
- 2015 Chaney Rd
- 1960 Chaney Rd
- 2025 Ogilby Rd
- 1965 Chaney Rd
- 2042 Chaney Rd
- 2585 Hillcrest Rd
Your Personal Tour Guide
Ask me questions while you tour the home.