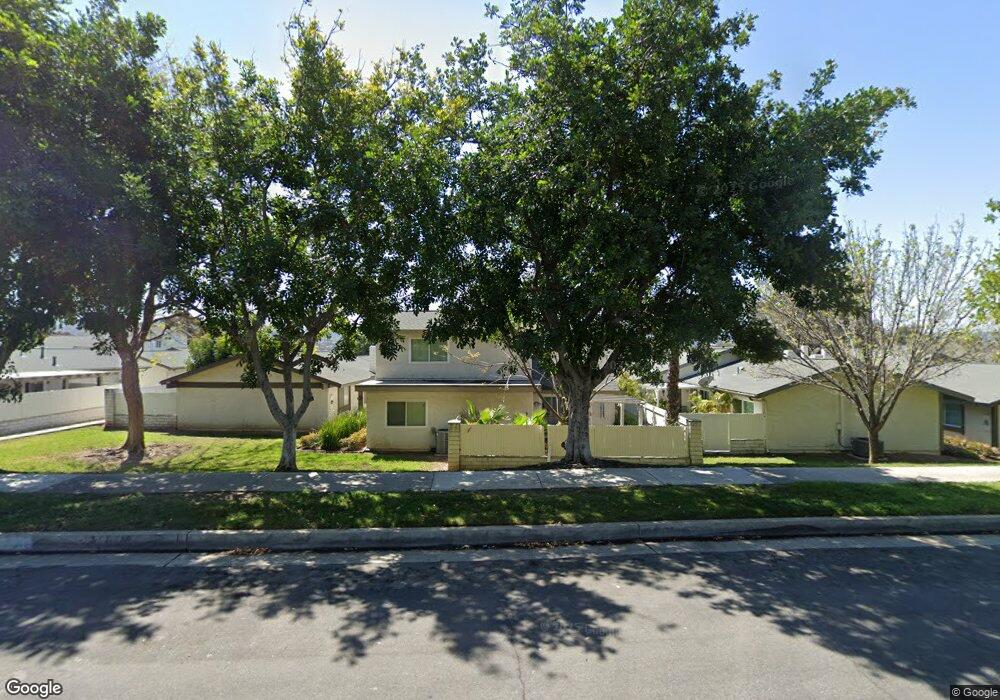
19991 Bentwood Ct Yorba Linda, CA 92886
Estimated Value: $777,377 - $810,000
4
Beds
2
Baths
1,302
Sq Ft
$611/Sq Ft
Est. Value
About This Home
This home is located at 19991 Bentwood Ct, Yorba Linda, CA 92886 and is currently estimated at $795,844, approximately $611 per square foot. 19991 Bentwood Ct is a home located in Orange County with nearby schools including Glenknoll Elementary, Bernardo Yorba Middle School, and Ivycrest Montessori Private School - Yorba Linda.
Ownership History
Date
Name
Owned For
Owner Type
Purchase Details
Closed on
Jun 3, 2025
Sold by
Yolanda Duran Living Trust and Valadez Karen
Bought by
Valadez Karen
Current Estimated Value
Home Financials for this Owner
Home Financials are based on the most recent Mortgage that was taken out on this home.
Original Mortgage
$340,000
Outstanding Balance
$339,127
Interest Rate
6.81%
Mortgage Type
New Conventional
Estimated Equity
$456,717
Purchase Details
Closed on
Jan 25, 2005
Sold by
Duran Yolanda
Bought by
Duran Yolanda and The Yoland Duran Living Trust
Purchase Details
Closed on
Dec 26, 1997
Sold by
Yolanda Duran and Yolanda Manuel
Bought by
Duran Yolanda
Home Financials for this Owner
Home Financials are based on the most recent Mortgage that was taken out on this home.
Original Mortgage
$60,000
Interest Rate
7.16%
Create a Home Valuation Report for This Property
The Home Valuation Report is an in-depth analysis detailing your home's value as well as a comparison with similar homes in the area
Home Values in the Area
Average Home Value in this Area
Purchase History
| Date | Buyer | Sale Price | Title Company |
|---|---|---|---|
| Valadez Karen | $795,000 | Fidelity National Title | |
| Duran Yolanda | -- | -- | |
| Duran Yolanda | -- | California Counties Title Co |
Source: Public Records
Mortgage History
| Date | Status | Borrower | Loan Amount |
|---|---|---|---|
| Open | Valadez Karen | $340,000 | |
| Previous Owner | Duran Yolanda | $60,000 |
Source: Public Records
Tax History Compared to Growth
Tax History
| Year | Tax Paid | Tax Assessment Tax Assessment Total Assessment is a certain percentage of the fair market value that is determined by local assessors to be the total taxable value of land and additions on the property. | Land | Improvement |
|---|---|---|---|---|
| 2025 | $1,246 | $81,407 | $36,772 | $44,635 |
| 2024 | $1,246 | $79,811 | $36,051 | $43,760 |
| 2023 | $1,212 | $78,247 | $35,345 | $42,902 |
| 2022 | $1,188 | $76,713 | $34,652 | $42,061 |
| 2021 | $1,164 | $75,209 | $33,972 | $41,237 |
| 2020 | $1,093 | $74,438 | $33,623 | $40,815 |
| 2019 | $1,064 | $72,979 | $32,964 | $40,015 |
| 2018 | $1,050 | $71,549 | $32,318 | $39,231 |
| 2017 | $1,033 | $70,147 | $31,685 | $38,462 |
| 2016 | $1,109 | $68,772 | $31,064 | $37,708 |
| 2015 | $1,094 | $67,739 | $30,597 | $37,142 |
| 2014 | $1,066 | $66,413 | $29,998 | $36,415 |
Source: Public Records
Map
Nearby Homes
- 19816 White Spring Ln Unit 36
- 20002 Wrightwood Ct Unit 31
- 6692 Palma Cir
- 6681 Palma Cir
- 6478 Horse Shoe Ln Unit 9
- 6437 Horse Shoe Ln Unit 2
- 6692 Moselle Cir
- 6473 Horse Shoe Ln Unit 6
- 6821 Rocky Grove Ct Unit 13
- 6635 Bridle Cir
- 20065 Berkeley Way
- 20267 Clear River Ln Unit 7
- 6375 Tiburon Terrace
- 19931 Crestknoll Dr
- 20453 Elm Hill Ln Unit 26
- 6305 Saint Francis Ct
- 5815 E La Palma Ave Unit 74
- 5815 E La Palma Ave Unit 190
- 5815 E La Palma Ave Unit 133
- 5497 E Willow Woods Ln Unit C
- 20001 Bentwood Ct Unit 6
- 19981 Bentwood Ct
- 19971 Bentwood Ct Unit 3
- 20002 Bentwood Ct
- 20011 Royal Oak Ct Unit 42
- 19992 Bentwood Ct Unit 8
- 19992 Bentwood Ct
- 19982 Bentwood Ct Unit 9
- 20012 Royal Oak Ct
- 19961 Bentwood Ct Unit 2
- 19972 Bentwood Ct Unit 10
- 20021 Royal Oak Ct Unit 41
- 20022 Royal Oak Ct Unit 44
- 19962 Bentwood Ct
- 19951 Bentwood Ct
- 19832 White Spring Ln Unit 29
- 19834 White Spring Ln Unit 30
- 20026 Royal Oak Ct Unit 45
- 20026 Royal Oak Ct