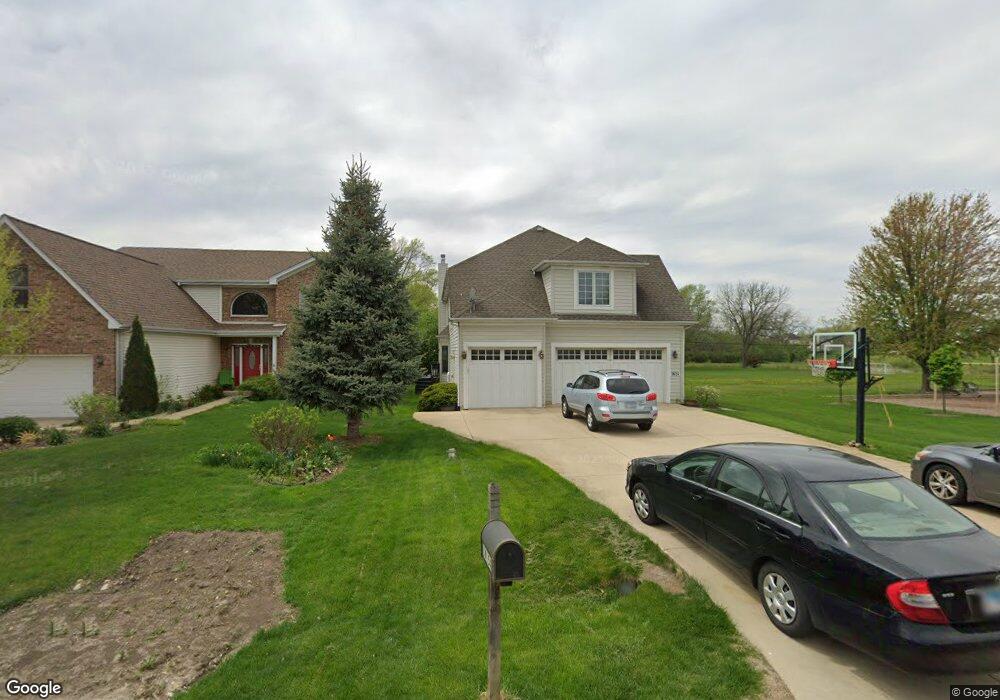
1N154 Morse St Carol Stream, IL 60188
South Carol Stream NeighborhoodEstimated Value: $565,000 - $705,000
--
Bed
1
Bath
2,953
Sq Ft
$217/Sq Ft
Est. Value
About This Home
This home is located at 1N154 Morse St, Carol Stream, IL 60188 and is currently estimated at $640,737, approximately $216 per square foot. 1N154 Morse St is a home located in DuPage County with nearby schools including Washington Elementary School, Monroe Middle School, and Wheaton North High School.
Ownership History
Date
Name
Owned For
Owner Type
Purchase Details
Closed on
Apr 3, 2007
Sold by
Fandel Richard M and Fandel Darlene M
Bought by
Zander Albert and Zander Lorraine
Current Estimated Value
Home Financials for this Owner
Home Financials are based on the most recent Mortgage that was taken out on this home.
Original Mortgage
$449,538
Outstanding Balance
$287,557
Interest Rate
6.37%
Mortgage Type
Construction
Estimated Equity
$353,180
Create a Home Valuation Report for This Property
The Home Valuation Report is an in-depth analysis detailing your home's value as well as a comparison with similar homes in the area
Home Values in the Area
Average Home Value in this Area
Purchase History
| Date | Buyer | Sale Price | Title Company |
|---|---|---|---|
| Zander Albert | $160,000 | Pntn |
Source: Public Records
Mortgage History
| Date | Status | Borrower | Loan Amount |
|---|---|---|---|
| Open | Zander Albert | $449,538 |
Source: Public Records
Tax History Compared to Growth
Tax History
| Year | Tax Paid | Tax Assessment Tax Assessment Total Assessment is a certain percentage of the fair market value that is determined by local assessors to be the total taxable value of land and additions on the property. | Land | Improvement |
|---|---|---|---|---|
| 2024 | $11,406 | $182,722 | $15,090 | $167,632 |
| 2023 | $10,926 | $168,190 | $13,890 | $154,300 |
| 2022 | $10,688 | $158,950 | $13,120 | $145,830 |
| 2021 | $10,368 | $155,180 | $12,810 | $142,370 |
| 2020 | $10,214 | $153,730 | $12,690 | $141,040 |
| 2019 | $9,963 | $149,670 | $12,350 | $137,320 |
| 2018 | $11,223 | $165,780 | $11,640 | $154,140 |
| 2017 | $11,021 | $159,660 | $11,210 | $148,450 |
| 2016 | $10,862 | $153,280 | $10,760 | $142,520 |
| 2015 | $10,770 | $146,230 | $10,260 | $135,970 |
| 2014 | $10,954 | $146,000 | $11,380 | $134,620 |
| 2013 | $10,577 | $146,430 | $11,410 | $135,020 |
Source: Public Records
Map
Nearby Homes
- 0 Ellis Ave
- 25W275 Doris Ave
- 25W277 Doris Ave
- 25W361 Doris Ave
- 0N649 Knollwood Dr
- 0N510 Gary Ave
- 1426 Preserve Dr Unit 30
- 1035 Quarry Ct Unit 9
- 26W080 Wood Lark Dr
- 631 Belmont Ln
- 628 Belmont Ln
- 1902 N Washington St
- 26W185 Meadowview Ct
- 26W199 Klein Creek Dr
- 26W181 Grand Ave
- 114 W Prairie Ave
- 27W130 W Street Charles Rd
- Lot 2 W Street Charles Rd
- 1115 N Main St
- 1N100 Harriet St
- 1N146 Morse St
- 1N138 Morse St
- 1N157 Morse St
- 1N135 Farwell St
- 1N159 Morse St
- 1N020 Morse St
- 1N120 Morse St
- 1N183 Morse St
- 1N183 Morse St
- 1N121 Farwell St
- 1N121 Morse St
- 1N010 Morse St
- 1N158 Ellis Ave
- 1N140 Ellis Ave
- 1N111 Farwell St
- 1N170 Ellis Ave
- 1N209 Morse St
- 1N180 Ellis Ave
- 1N124 Ellis Ave
- 1N124 Ellis Ave