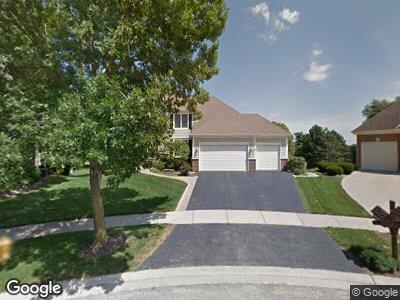
1N431 Lytham Ct Unit 1A Winfield, IL 60190
Estimated Value: $715,096 - $819,000
40
Beds
2
Baths
5,041
Sq Ft
$149/Sq Ft
Est. Value
About This Home
This home is located at 1N431 Lytham Ct Unit 1A, Winfield, IL 60190 and is currently estimated at $753,024, approximately $149 per square foot. 1N431 Lytham Ct Unit 1A is a home located in DuPage County with nearby schools including Pleasant Hill Elementary School, Monroe Middle School, and Wheaton North High School.
Ownership History
Date
Name
Owned For
Owner Type
Purchase Details
Closed on
Sep 26, 2015
Sold by
Pflederer Richard D and Pflederer Gail E
Bought by
Pflederer Gail E and Gail E Pflederer 2015 Trust
Current Estimated Value
Purchase Details
Closed on
Jun 7, 2003
Sold by
Parisek Robert F and Parisek Jeanne L
Bought by
Pflederer Richard D and Pflederer Gail E
Home Financials for this Owner
Home Financials are based on the most recent Mortgage that was taken out on this home.
Original Mortgage
$100,000
Interest Rate
6.44%
Mortgage Type
Purchase Money Mortgage
Purchase Details
Closed on
Dec 8, 1997
Sold by
American National Bk & Tr Co Of Chicago
Bought by
Parisek Robert F and Parisek Jeanne L
Home Financials for this Owner
Home Financials are based on the most recent Mortgage that was taken out on this home.
Original Mortgage
$210,000
Interest Rate
6%
Create a Home Valuation Report for This Property
The Home Valuation Report is an in-depth analysis detailing your home's value as well as a comparison with similar homes in the area
Home Values in the Area
Average Home Value in this Area
Purchase History
| Date | Buyer | Sale Price | Title Company |
|---|---|---|---|
| Pflederer Gail E | -- | Attorney | |
| Pflederer Richard D | $510,000 | Pntn | |
| Parisek Robert F | $410,000 | -- |
Source: Public Records
Mortgage History
| Date | Status | Borrower | Loan Amount |
|---|---|---|---|
| Open | Pflederer Gall E | $300,000 | |
| Closed | Pflederer Richard D | $250,000 | |
| Previous Owner | Pflederer Richard D | $100,000 | |
| Previous Owner | Parisek Robert F | $235,000 | |
| Previous Owner | Parisek Robert F | $210,000 |
Source: Public Records
Tax History Compared to Growth
Tax History
| Year | Tax Paid | Tax Assessment Tax Assessment Total Assessment is a certain percentage of the fair market value that is determined by local assessors to be the total taxable value of land and additions on the property. | Land | Improvement |
|---|---|---|---|---|
| 2023 | $13,122 | $205,290 | $47,640 | $157,650 |
| 2022 | $12,656 | $180,170 | $45,020 | $135,150 |
| 2021 | $11,983 | $175,890 | $43,950 | $131,940 |
| 2020 | $11,811 | $174,250 | $43,540 | $130,710 |
| 2019 | $11,559 | $169,650 | $42,390 | $127,260 |
| 2018 | $12,157 | $176,260 | $39,950 | $136,310 |
| 2017 | $11,944 | $169,760 | $38,480 | $131,280 |
| 2016 | $11,785 | $162,980 | $36,940 | $126,040 |
| 2015 | $11,710 | $155,480 | $35,240 | $120,240 |
| 2014 | $12,061 | $157,350 | $37,020 | $120,330 |
| 2013 | $11,647 | $157,820 | $37,130 | $120,690 |
Source: Public Records
Map
Nearby Homes
- 26W191 Klein Creek Dr Unit 191
- 26W376 Torrey Pines Ct
- 26W097 Klein Creek Dr Unit 97
- 26W116 Klein Creek Dr
- 25W728 Golf View Ln
- 1N598 Golf View Ln
- 1N587 Golf View Ln
- 26W010 Macarthur Ave
- 26W024 Klein Creek Dr Unit 4
- 27W130 W Street Charles Rd
- Lot 2 W Street Charles Rd
- 1N175 Mission Ct
- 26W441 Geneva Rd
- 1N039 Mission Ct
- 27W125 Chestnut Ln
- 27W137 Chestnut Ln
- 26W065 Jerome Ave
- 336 Sype Dr
- 26W181 Grand Ave
- 1N298 Purnell St
- 1N431 Lytham Ct Unit 1A
- 1N447 Lytham Ct Unit 1A
- 1N415 Lytham Ct
- 1N416 Lytham Ct
- 1N463 Lytham Ct
- 1N432 Lytham Ct
- 1N448 Lytham Ct
- 26W215 Glen Eagles Dr
- 1N448 Lytham Ct
- 26W193 Prestwick Ln
- 26W263 Glen Eagles Dr
- 26W173 Prestwick Ln Unit 1B
- 26W173 Prestwick Ln Unit 1B
- 26W230 Glen Eagles Dr
- 26W216 Glen Eagles Dr
- 26W165 Prestwick Ln
- 26W242 Glen Eagles Dr
- 26W194 Prestwick Ln
- 26W254 Glen Eagles Dr
- 26W143 Prestwick Ln