C
Landlord's Agent in 2025
Catherine Stahl
Sotheby's International Realty
(203) 273-2711
1 in this area
8 Total Sales
Estimated Value: $1,032,000 - $1,254,000
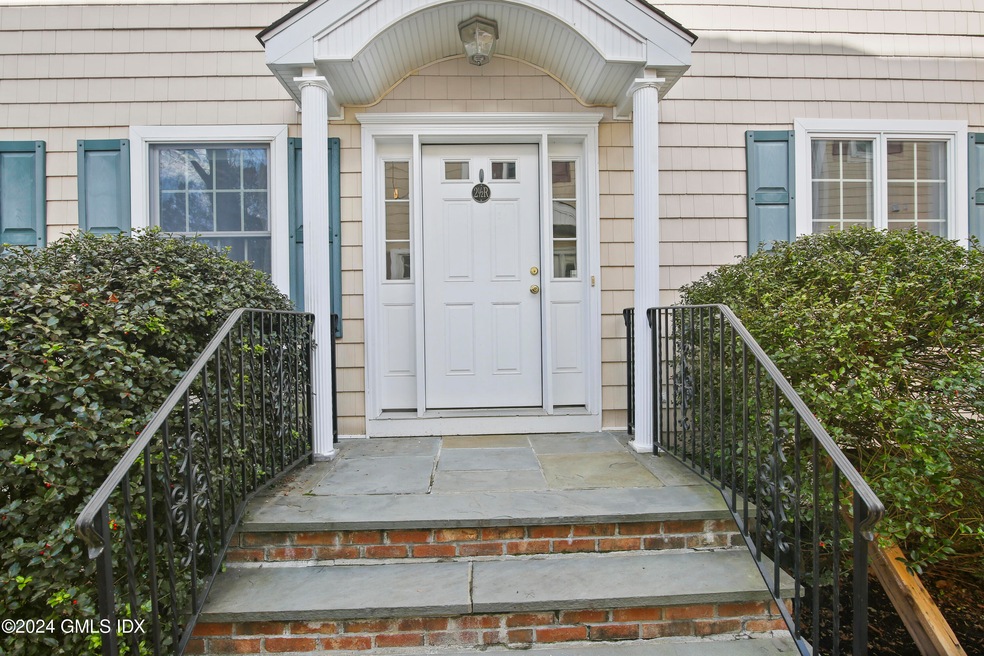
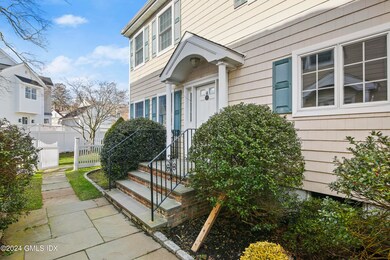
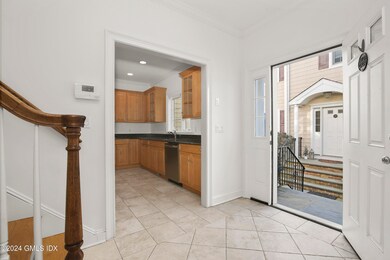
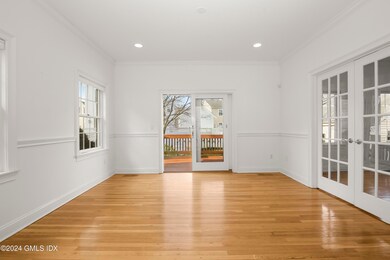
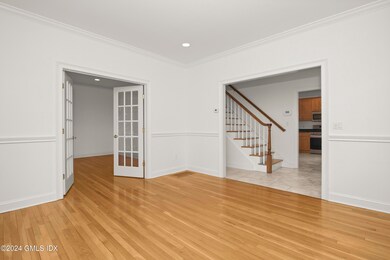
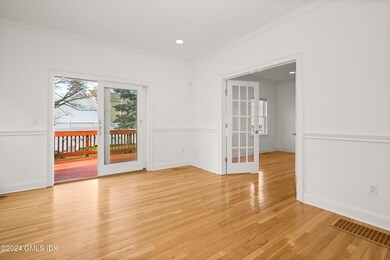
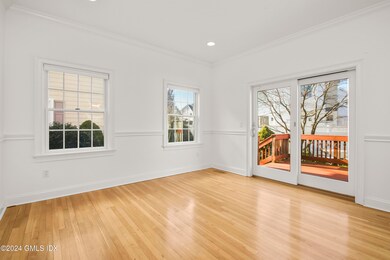
Spacious move-in three bedroom, two full and one half Bath Townhome in Cos Cob on three levels. Large eat-in Kitchen has granite counters and stainless steel appliances. Family Room with a gas fireplace is adjacent to the Kitchen. Slider in the Living Room opens onto the Deck which overlooks a large fenced-in yard. There are French Doors in the Living Room opening into the formal Dining Room. The Primary Suite has a walk-in closet. There are two additional bedrooms and a bath. The beautifully finished Lower Level with built-is also has a large storage room with the utilities. There are hardwood floors throughout and two deeded parking spaces. It is six-minutes to the elementary school. The unit is available on February 1st
Last Agent to Rent the Property
Sotheby's International Realty License #RES.0649904 Listed on: 12/05/2024

Last Renter's Agent
Sotheby's International Realty License #RES.0649904 Listed on: 12/05/2024
| Date | Buyer | Sale Price | Title Company |
|---|---|---|---|
| Arlia Carlos Tomas | $817,500 | -- |
| Date | Status | Borrower | Loan Amount |
|---|---|---|---|
| Open | Arlia Carlos Tomas | $654,000 |
| Date | Event | Price | List to Sale | Price per Sq Ft |
|---|---|---|---|---|
| 01/21/2025 01/21/25 | Rented | $5,600 | 0.0% | -- |
| 01/21/2025 01/21/25 | Under Contract | -- | -- | -- |
| 12/05/2024 12/05/24 | For Rent | $5,600 | +1.8% | -- |
| 01/29/2024 01/29/24 | Rented | $5,500 | 0.0% | -- |
| 01/29/2024 01/29/24 | Under Contract | -- | -- | -- |
| 01/17/2024 01/17/24 | For Rent | $5,500 | -- | -- |
| Year | Tax Paid | Tax Assessment Tax Assessment Total Assessment is a certain percentage of the fair market value that is determined by local assessors to be the total taxable value of land and additions on the property. | Land | Improvement |
|---|---|---|---|---|
| 2025 | $6,320 | $511,350 | $0 | $511,350 |
| 2024 | $6,103 | $511,350 | $0 | $511,350 |
| 2023 | $5,950 | $511,350 | $0 | $511,350 |
| 2022 | $5,896 | $511,350 | $0 | $511,350 |
| 2021 | $5,952 | $494,340 | $0 | $494,340 |
| 2020 | $5,734 | $477,050 | $0 | $477,050 |
| 2019 | $5,791 | $477,050 | $0 | $477,050 |
| 2018 | $5,901 | $477,050 | $0 | $477,050 |
| 2017 | $5,734 | $477,050 | $0 | $477,050 |
| 2016 | $5,643 | $477,050 | $0 | $477,050 |
| 2015 | $5,635 | $472,500 | $0 | $472,500 |
| 2014 | $5,493 | $472,500 | $0 | $472,500 |
C
Landlord's Agent in 2025
Catherine Stahl
Sotheby's International Realty
(203) 273-2711
1 in this area
8 Total Sales
Buyer's Agent in 2024
Kimberly James
Houlihan Lawrence
(203) 979-9166
3 in this area
35 Total Sales
Source: Greenwich Association of REALTORS®
MLS Number: 121811
APN: GREE-000008A-000000-001985-S000000
Disclaimer: Certain information contained herein is derived from information provided by parties other than Homes.com. All information provided is deemed reliable, but is not guaranteed to be accurate and should be independently verified.
![]() Listing data courtesy of Greenwich MLS. IDX information is provided exclusively for consumers’ personal, non-commercial use, that it may not be used for any purpose other than to
Listing data courtesy of Greenwich MLS. IDX information is provided exclusively for consumers’ personal, non-commercial use, that it may not be used for any purpose other than to
identify prospective properties consumers may be interested in purchasing. Data is deemed reliable but is not guaranteed accurate by the MLS.