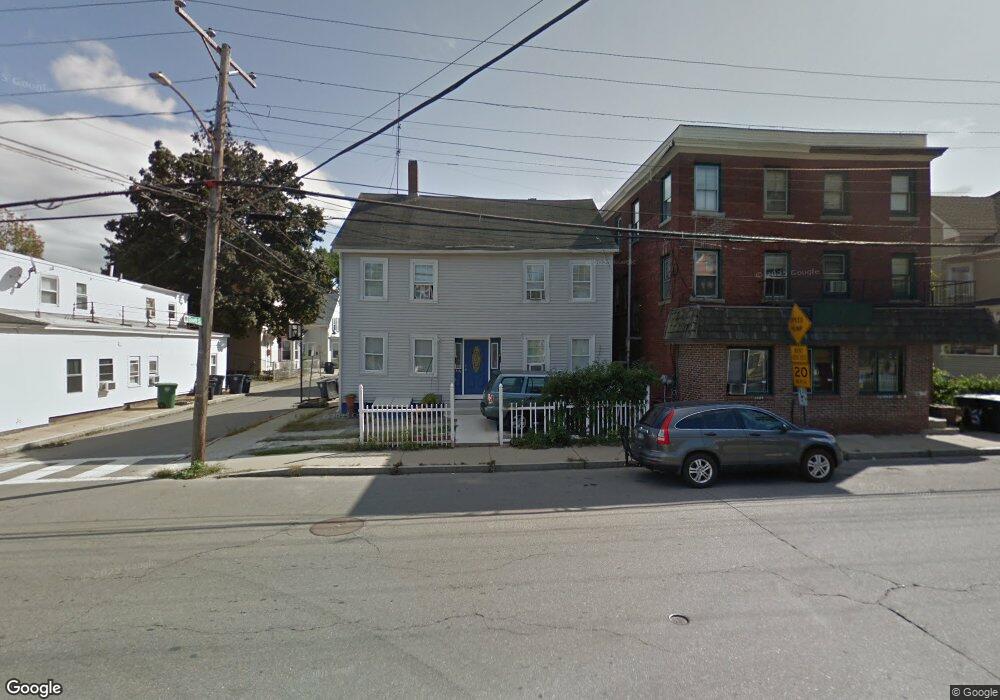
2 1/2 E Pearl St Nashua, NH 03060
Downtown Nashua NeighborhoodEstimated Value: $399,000 - $414,000
8
Beds
2
Baths
1,841
Sq Ft
$221/Sq Ft
Est. Value
About This Home
This home is located at 2 1/2 E Pearl St, Nashua, NH 03060 and is currently estimated at $406,441, approximately $220 per square foot. 2 1/2 E Pearl St is a home located in Hillsborough County with nearby schools including Amherst Street School, Pennichuck Middle School, and Nashua High School North.
Ownership History
Date
Name
Owned For
Owner Type
Purchase Details
Closed on
Apr 1, 2022
Sold by
Duncan Damari
Bought by
Duncan Damari and Delrosario Pedro A
Current Estimated Value
Home Financials for this Owner
Home Financials are based on the most recent Mortgage that was taken out on this home.
Original Mortgage
$111,000
Outstanding Balance
$96,625
Interest Rate
3.83%
Mortgage Type
Stand Alone Refi Refinance Of Original Loan
Purchase Details
Closed on
Dec 11, 1997
Sold by
Harrison Robert C and Harrison Diane C
Bought by
Duncan Anthony A and Duncan Damari
Home Financials for this Owner
Home Financials are based on the most recent Mortgage that was taken out on this home.
Original Mortgage
$47,838
Interest Rate
7.14%
Purchase Details
Closed on
--
Sold by
Harrison Robert C and Harrison Diane C
Bought by
Duncan Anthony A and Duncan Damari
Create a Home Valuation Report for This Property
The Home Valuation Report is an in-depth analysis detailing your home's value as well as a comparison with similar homes in the area
Home Values in the Area
Average Home Value in this Area
Purchase History
| Date | Buyer | Sale Price | Title Company |
|---|---|---|---|
| Duncan Damari | -- | None Available | |
| Duncan Damari | -- | None Available | |
| Duncan Anthony A | $47,000 | -- | |
| Duncan Anthony A | $47,000 | -- |
Source: Public Records
Mortgage History
| Date | Status | Borrower | Loan Amount |
|---|---|---|---|
| Open | Duncan Damari | $111,000 | |
| Closed | Duncan Damari | $111,000 | |
| Previous Owner | Duncan Anthony A | $50,000 | |
| Previous Owner | Duncan Anthony A | $47,838 |
Source: Public Records
Tax History Compared to Growth
Tax History
| Year | Tax Paid | Tax Assessment Tax Assessment Total Assessment is a certain percentage of the fair market value that is determined by local assessors to be the total taxable value of land and additions on the property. | Land | Improvement |
|---|---|---|---|---|
| 2023 | $5,618 | $308,200 | $66,100 | $242,100 |
| 2022 | $5,569 | $308,200 | $66,100 | $242,100 |
| 2021 | $4,584 | $197,400 | $44,100 | $153,300 |
| 2020 | $4,285 | $189,500 | $44,100 | $145,400 |
| 2019 | $4,124 | $189,500 | $44,100 | $145,400 |
| 2018 | $4,019 | $189,500 | $44,100 | $145,400 |
| 2017 | $3,825 | $148,300 | $44,500 | $103,800 |
| 2016 | $3,718 | $148,300 | $44,500 | $103,800 |
| 2015 | $3,638 | $148,300 | $44,500 | $103,800 |
| 2014 | $3,567 | $148,300 | $44,500 | $103,800 |
Source: Public Records
Map
Nearby Homes
- 103 Temple St
- 21 E Pearl St
- 3-5 Howard St
- 14 Cottage St
- 7 Commercial St
- 18 Harbor Ave Unit 103
- 52 Main St Unit 201
- 7 Morrill St
- 5 Mulberry St
- 13 Norton St
- 43 Cross St
- 24 E Otterson St
- 4 Arlington Ave
- 4 Nye Ave
- 27 Beech St Unit 54
- 100 Bowers St
- 43 Laton St Unit B
- 43 Laton St Unit A
- 66 Harbor Ave Unit 5
- 13 Manchester St Unit 85