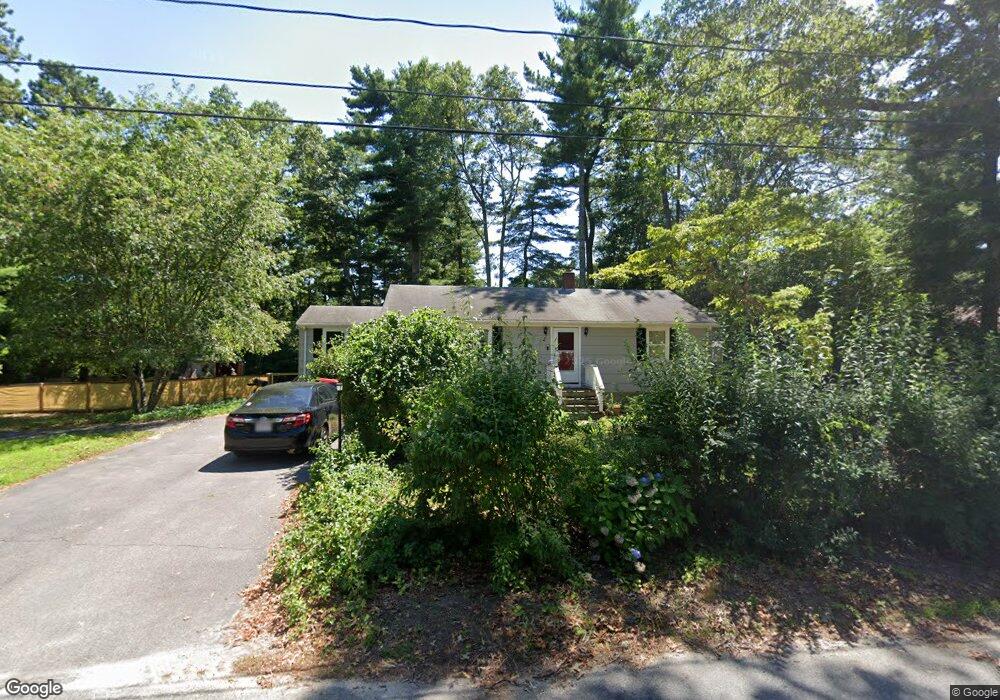
2 16th Ave Wareham, MA 02571
Weweantic NeighborhoodEstimated Value: $427,474 - $447,000
3
Beds
1
Bath
800
Sq Ft
$550/Sq Ft
Est. Value
About This Home
This home is located at 2 16th Ave, Wareham, MA 02571 and is currently estimated at $439,869, approximately $549 per square foot. 2 16th Ave is a home located in Plymouth County with nearby schools including Tabor Academy.
Ownership History
Date
Name
Owned For
Owner Type
Purchase Details
Closed on
Apr 29, 2022
Sold by
Aldred Mark and Aldred George
Bought by
Carey Zachary and Aldred Allison
Current Estimated Value
Home Financials for this Owner
Home Financials are based on the most recent Mortgage that was taken out on this home.
Original Mortgage
$332,500
Outstanding Balance
$311,490
Interest Rate
4.16%
Mortgage Type
Purchase Money Mortgage
Estimated Equity
$128,379
Purchase Details
Closed on
Feb 4, 2022
Sold by
Aldred Ft and Chambers
Bought by
Aldred Mark and Aldred George
Purchase Details
Closed on
Jan 11, 1994
Sold by
Nelson Alma G
Bought by
Merzi Estelle and Merzi Peter L
Create a Home Valuation Report for This Property
The Home Valuation Report is an in-depth analysis detailing your home's value as well as a comparison with similar homes in the area
Home Values in the Area
Average Home Value in this Area
Purchase History
| Date | Buyer | Sale Price | Title Company |
|---|---|---|---|
| Carey Zachary | $350,000 | None Available | |
| Carey Zachary | $350,000 | None Available | |
| Aldred Mark | -- | None Available | |
| Aldred Mark | -- | None Available | |
| Aldred Mark | -- | None Available | |
| Merzi Estelle | $61,000 | -- | |
| Merzi Estelle | $61,000 | -- |
Source: Public Records
Mortgage History
| Date | Status | Borrower | Loan Amount |
|---|---|---|---|
| Open | Carey Zachary | $332,500 | |
| Closed | Carey Zachary | $332,500 |
Source: Public Records
Tax History
| Year | Tax Paid | Tax Assessment Tax Assessment Total Assessment is a certain percentage of the fair market value that is determined by local assessors to be the total taxable value of land and additions on the property. | Land | Improvement |
|---|---|---|---|---|
| 2025 | $3,822 | $366,800 | $111,400 | $255,400 |
| 2024 | $3,808 | $339,100 | $87,500 | $251,600 |
| 2023 | $3,480 | $305,200 | $79,500 | $225,700 |
| 2022 | $3,480 | $264,000 | $79,500 | $184,500 |
| 2021 | $3,447 | $256,300 | $79,500 | $176,800 |
| 2020 | $3,227 | $243,400 | $79,500 | $163,900 |
| 2019 | $2,893 | $217,700 | $78,300 | $139,400 |
| 2018 | $2,725 | $199,900 | $78,300 | $121,600 |
| 2017 | $2,576 | $191,500 | $78,300 | $113,200 |
| 2016 | $2,370 | $175,200 | $77,700 | $97,500 |
| 2015 | $2,290 | $175,200 | $77,700 | $97,500 |
| 2014 | $2,231 | $173,600 | $73,800 | $99,800 |
Source: Public Records
Map
Nearby Homes
Your Personal Tour Guide
Ask me questions while you tour the home.