2 2 8 0 2 8 0 Garnet Ave Pacific Beach, CA 92109
Pacific Beach NeighborhoodEstimated Value: $3,820,953
--
Bed
--
Bath
5,840
Sq Ft
$654/Sq Ft
Est. Value
About This Home
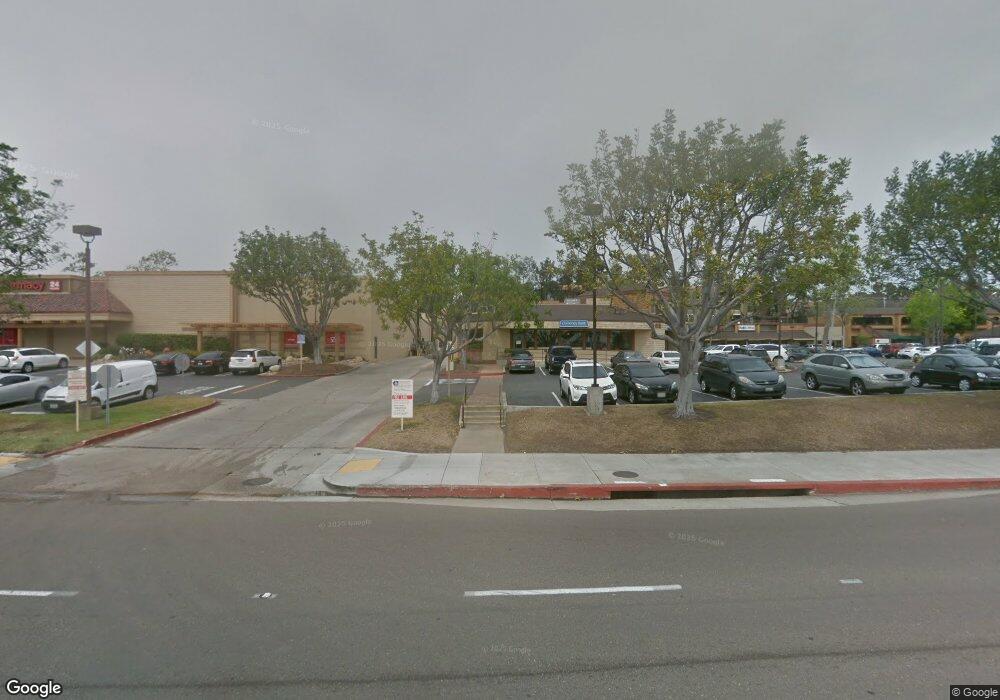
This home is located at 2 2 8 0 2 8 0 Garnet Ave, Pacific Beach, CA 92109 and is currently estimated at $3,820,953, approximately $654 per square foot. 2 2 8 0 2 8 0 Garnet Ave is a home located in San Diego County with nearby schools including Sessions Elementary School, Pacific Beach Middle, and Mission Bay High School.
Ownership History
Date
Name
Owned For
Owner Type
Purchase Details
Closed on
Oct 25, 2012
Sold by
San Diego Income Properties Llc
Bought by
A & S Group Llc
Current Estimated Value
Home Financials for this Owner
Home Financials are based on the most recent Mortgage that was taken out on this home.
Original Mortgage
$990,000
Interest Rate
3.34%
Mortgage Type
Commercial
Purchase Details
Closed on
Mar 24, 2011
Sold by
Foley Property Assets Llc
Bought by
San Diego Income Properties Llc
Purchase Details
Closed on
Oct 25, 2007
Sold by
Maddox Millard D and Maddox Judith G
Bought by
Foley Property Assets Llc
Home Financials for this Owner
Home Financials are based on the most recent Mortgage that was taken out on this home.
Original Mortgage
$781,600
Interest Rate
6.07%
Mortgage Type
Commercial
Purchase Details
Closed on
Dec 17, 1996
Sold by
Boardwalk Enterprises
Bought by
Maddox Millard D and Maddox Judith G
Purchase Details
Closed on
Jun 12, 1992
Purchase Details
Closed on
Jan 24, 1989
Purchase Details
Closed on
Jul 17, 1985
Create a Home Valuation Report for This Property
The Home Valuation Report is an in-depth analysis detailing your home's value as well as a comparison with similar homes in the area
Home Values in the Area
Average Home Value in this Area
Purchase History
| Date | Buyer | Sale Price | Title Company |
|---|---|---|---|
| A & S Group Llc | $1,580,000 | Title365 | |
| San Diego Income Properties Llc | -- | None Available | |
| Foley Property Assets Llc | $1,150,000 | Fidelity National Title Co | |
| Maddox Millard D | -- | Orange Coast Title | |
| -- | $539,000 | -- | |
| -- | $798,000 | -- | |
| -- | $175,000 | -- |
Source: Public Records
Mortgage History
| Date | Status | Borrower | Loan Amount |
|---|---|---|---|
| Previous Owner | A & S Group Llc | $990,000 | |
| Previous Owner | Foley Property Assets Llc | $781,600 |
Source: Public Records
Tax History Compared to Growth
Tax History
| Year | Tax Paid | Tax Assessment Tax Assessment Total Assessment is a certain percentage of the fair market value that is determined by local assessors to be the total taxable value of land and additions on the property. | Land | Improvement |
|---|---|---|---|---|
| 2025 | $23,672 | $1,963,673 | $1,108,279 | $855,394 |
| 2024 | $23,672 | $1,925,171 | $1,086,549 | $838,622 |
| 2023 | $23,152 | $1,887,424 | $1,065,245 | $822,179 |
| 2022 | $22,536 | $1,850,416 | $1,044,358 | $806,058 |
| 2021 | $22,382 | $1,814,134 | $1,023,881 | $790,253 |
| 2020 | $22,111 | $1,795,533 | $1,013,383 | $782,150 |
| 2019 | $21,716 | $1,760,327 | $993,513 | $766,814 |
| 2018 | $20,300 | $1,725,812 | $974,033 | $751,779 |
| 2017 | $19,819 | $1,691,974 | $954,935 | $737,039 |
| 2016 | $19,507 | $1,658,799 | $936,211 | $722,588 |
| 2015 | $19,218 | $1,633,884 | $922,149 | $711,735 |
| 2014 | $18,740 | $1,587,173 | $904,086 | $683,087 |
Source: Public Records
Map
Nearby Homes
- 2346 Grand Ave
- 2114 Felspar St
- 2050 Garnet Ave
- 2045 Emerald St Unit 3
- 2036-38 Emerald St
- 2128 Missouri St
- 2134 Reed Ave
- 4730 Noyes St Unit 106
- 2318 Chalcedony St
- 2028 Thomas Ave Unit 32
- 2020 Diamond St Unit 12
- 4750 Noyes St Unit 110
- 1956 Hornblend St Unit 8
- 2002 Missouri St Unit 6
- 2669 Magnolia Ave
- 2023 Reed Ave Unit 1A
- 2522 Chalcedony St
- 4470 Bond St
- 2315 Geranium St
- 4647 Pico St Unit 205
- 2280 2280 Garnet Ave
- 2280 Garnet Ave
- 2262 Garnet Ave
- 2254.5 Garnet Ave
- 4530 Pendleton St Unit 42
- 2250-54 Garnet Ave
- 2250 Garnet Ave
- 2269 Felspar St
- 2252 Garnet Ave
- 2252.5 Garnet Ave
- 2254 Garnet Ave
- 2263 Felspar St Unit 4
- 2263 Felspar St
- 2261 Felspar St Unit 3
- 2253 1/2 Felspar St
- 2253 Felspar St
- 2265 Felspar St Unit 1
- 2267 Garnet Ave
- 2254 1/2 Garnet Ave
- 2263 Garnet Ave