2 2nd St Hudson, MA 01749
Estimated Value: $461,000 - $624,000
4
Beds
3
Baths
2,375
Sq Ft
$241/Sq Ft
Est. Value
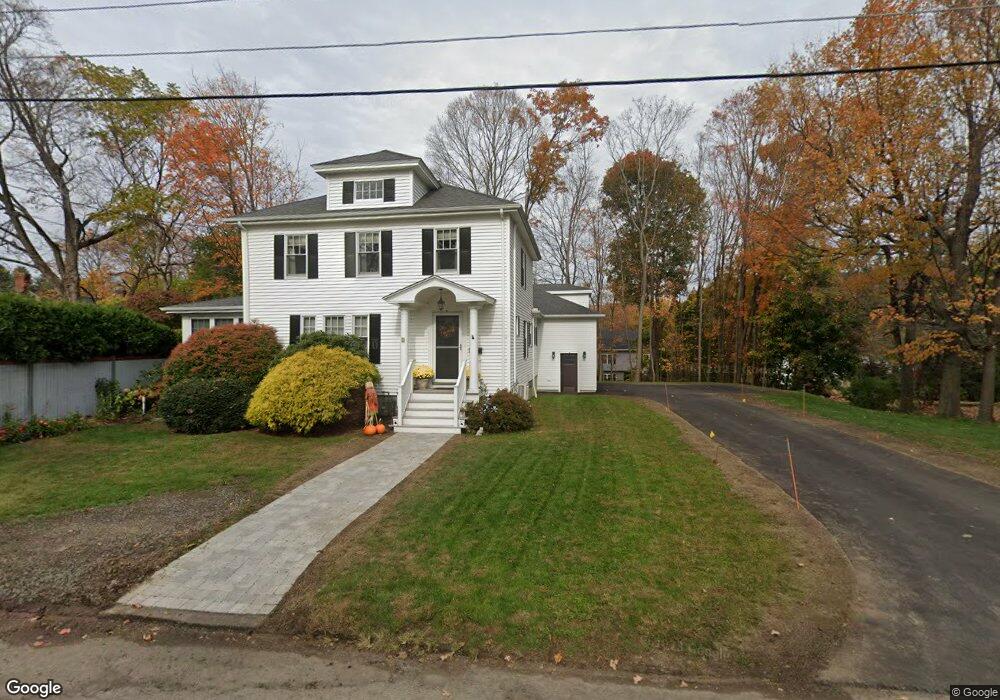
About This Home
This home is located at 2 2nd St, Hudson, MA 01749 and is currently estimated at $572,148, approximately $240 per square foot. 2 2nd St is a home located in Middlesex County with nearby schools including David J. Quinn Middle School, Hudson High School, and First Steps Children's Center.
Ownership History
Date
Name
Owned For
Owner Type
Purchase Details
Closed on
Sep 28, 2020
Sold by
Desmond Thomas W and Desmond Patricia E
Bought by
Desmond Joint Ret and Desmond
Current Estimated Value
Purchase Details
Closed on
Apr 26, 1983
Bought by
Desmond Thomas W
Create a Home Valuation Report for This Property
The Home Valuation Report is an in-depth analysis detailing your home's value as well as a comparison with similar homes in the area
Home Values in the Area
Average Home Value in this Area
Purchase History
| Date | Buyer | Sale Price | Title Company |
|---|---|---|---|
| Desmond Joint Ret | -- | None Available | |
| Desmond Joint Ret | -- | None Available | |
| Desmond Joint Ret | -- | None Available | |
| Desmond Thomas W | -- | -- |
Source: Public Records
Mortgage History
| Date | Status | Borrower | Loan Amount |
|---|---|---|---|
| Previous Owner | Desmond Thomas W | $17,000 | |
| Previous Owner | Desmond Thomas W | $77,000 | |
| Previous Owner | Desmond Thomas W | $72,000 |
Source: Public Records
Tax History
| Year | Tax Paid | Tax Assessment Tax Assessment Total Assessment is a certain percentage of the fair market value that is determined by local assessors to be the total taxable value of land and additions on the property. | Land | Improvement |
|---|---|---|---|---|
| 2025 | $7,788 | $561,100 | $166,800 | $394,300 |
| 2024 | $7,193 | $513,800 | $151,600 | $362,200 |
| 2023 | $7,005 | $479,800 | $145,800 | $334,000 |
| 2022 | $6,561 | $413,700 | $132,500 | $281,200 |
| 2021 | $6,382 | $384,700 | $126,200 | $258,500 |
| 2020 | $5,911 | $355,900 | $123,700 | $232,200 |
| 2019 | $5,366 | $315,100 | $123,700 | $191,400 |
| 2018 | $5,005 | $286,000 | $117,800 | $168,200 |
| 2017 | $4,627 | $264,400 | $112,200 | $152,200 |
| 2016 | $4,469 | $258,500 | $112,200 | $146,300 |
| 2015 | $4,343 | $251,500 | $112,200 | $139,300 |
| 2014 | $4,142 | $237,800 | $98,300 | $139,500 |
Source: Public Records
Map
Nearby Homes
- 2 Barracks Rd Unit 2
- 133 Lincoln St
- 25 Richard Rd
- 200 Manning St Unit 20A
- 128 Manning St
- 46 Church St Unit 2
- 21 Felton St
- 278 Manning St Unit 603
- 136 Central St Unit C6
- 4 Linden St
- 399 Long Hill Rd
- 3 Gerry Dr Unit 15
- 16 Barnes Blvd Unit 16
- 37 Tower St
- 16 Houghton St
- 17 School St Unit C
- 17 School St Unit A
- 110 River St
- 3 Highland Park Ave
- 11 Barracks Rd Unit 11
Your Personal Tour Guide
Ask me questions while you tour the home.