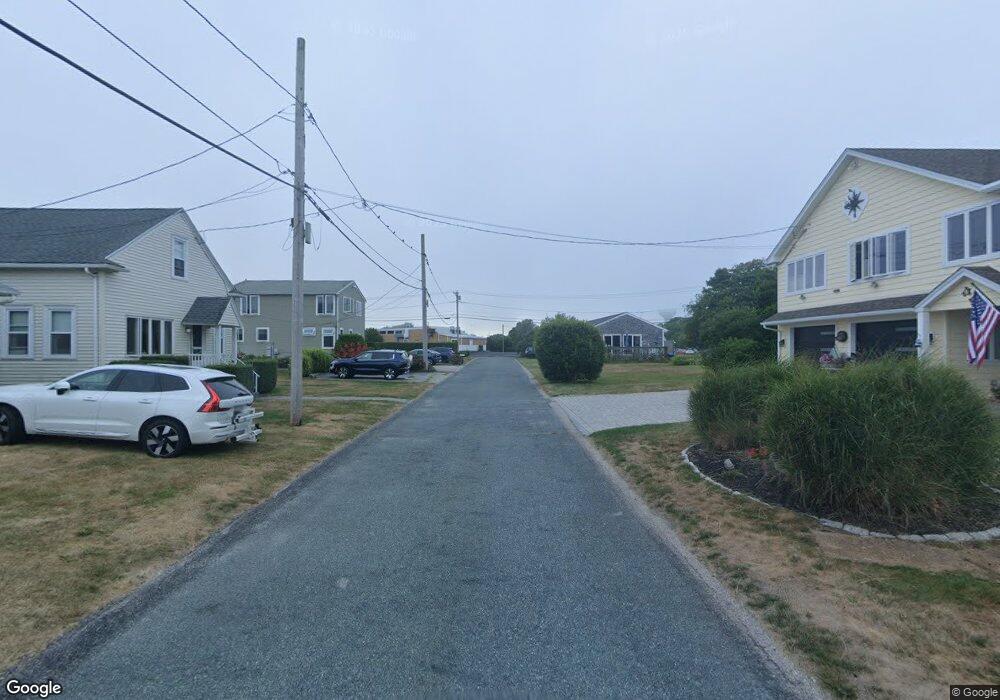
2 2sedge Ct Narragansett, RI 02882
Estimated Value: $733,000 - $778,000
2
Beds
1
Bath
825
Sq Ft
$922/Sq Ft
Est. Value
About This Home
This home is located at 2 2sedge Ct, Narragansett, RI 02882 and is currently estimated at $760,650, approximately $922 per square foot. 2 2sedge Ct is a home located in Washington County with nearby schools including Narragansett Elementary School, Narragansett Pier Middle School, and Narragansett High School.
Ownership History
Date
Name
Owned For
Owner Type
Purchase Details
Closed on
Sep 19, 2024
Sold by
Castelli Nicholas and Castelli Joanna R
Bought by
North End Realty Llc
Current Estimated Value
Purchase Details
Closed on
Nov 10, 2020
Sold by
Chofay Ronald
Bought by
Castelli Nicholas and Castelli Joanna R
Purchase Details
Closed on
Dec 24, 2018
Sold by
Reservoir Adventures Llc
Bought by
Narragansett 5-2016 Rigp
Purchase Details
Closed on
Jun 20, 2018
Sold by
Koury Fred
Bought by
Amy Realty Rigp
Purchase Details
Closed on
Aug 18, 2014
Sold by
Rig Civil Process Svcs
Bought by
Rig Civil Process Svcs
Purchase Details
Closed on
Aug 18, 2011
Sold by
Narragansett Town Of
Bought by
Rigp Amy Realy
Create a Home Valuation Report for This Property
The Home Valuation Report is an in-depth analysis detailing your home's value as well as a comparison with similar homes in the area
Home Values in the Area
Average Home Value in this Area
Purchase History
| Date | Buyer | Sale Price | Title Company |
|---|---|---|---|
| North End Realty Llc | $715,000 | None Available | |
| North End Realty Llc | $715,000 | None Available | |
| Castelli Nicholas | $600,000 | None Available | |
| Castelli Nicholas | $600,000 | None Available | |
| Narragansett 5-2016 Rigp | -- | -- | |
| Rigp Narragansett 5-2016 | -- | -- | |
| Reservoir Adventures Llc | -- | -- | |
| Amy Realty Rigp | -- | -- | |
| Amy Realty Rigp | -- | -- | |
| Rig Civil Process Svcs | $11,215 | -- | |
| Civil Process Svcs Rig | $11,215 | -- | |
| Rigp Amy Realy | $6,779 | -- | |
| Amy Realy Rigp | $6,779 | -- |
Source: Public Records
Tax History Compared to Growth
Tax History
| Year | Tax Paid | Tax Assessment Tax Assessment Total Assessment is a certain percentage of the fair market value that is determined by local assessors to be the total taxable value of land and additions on the property. | Land | Improvement |
|---|---|---|---|---|
| 2025 | $2,350 | $346,100 | $346,100 | $0 |
| 2024 | $2,267 | $346,100 | $346,100 | $0 |
| 2023 | $2,301 | $247,200 | $247,200 | $0 |
| 2022 | $2,225 | $247,200 | $247,200 | $0 |
| 2021 | $3,429 | $387,000 | $247,200 | $139,800 |
| 2020 | $3,954 | $377,300 | $278,700 | $98,600 |
| 2019 | $3,860 | $377,300 | $278,700 | $98,600 |
| 2018 | $3,754 | $377,300 | $278,700 | $98,600 |
| 2017 | $3,163 | $299,500 | $262,300 | $37,200 |
| 2016 | $3,019 | $299,500 | $262,300 | $37,200 |
| 2015 | $2,977 | $299,500 | $262,300 | $37,200 |
| 2014 | $3,324 | $331,100 | $275,400 | $55,700 |
Source: Public Records
Map
Nearby Homes
- 89 Sand Hill Cove Rd
- 110 Houston Ave
- 100 Chestnut Ave
- 1125 Point Judith Rd Unit B6
- 129 Sand Hill Cove Rd
- 0 Point Judith Rd
- 6 Lane 4
- 4 Lane 3
- 271 Great Island Rd
- 8 Pocono Rd
- 1046 Ocean Rd
- 1044 Ocean Rd
- 18 Beach Row
- 25 Scallop Shell Rd
- 16 Percy Ln
- 31 E Pond Rd
- 17 Goose Island Rd
- 6 MacAlder St
- 8 Knowlesway
- 45 Durkin Dr