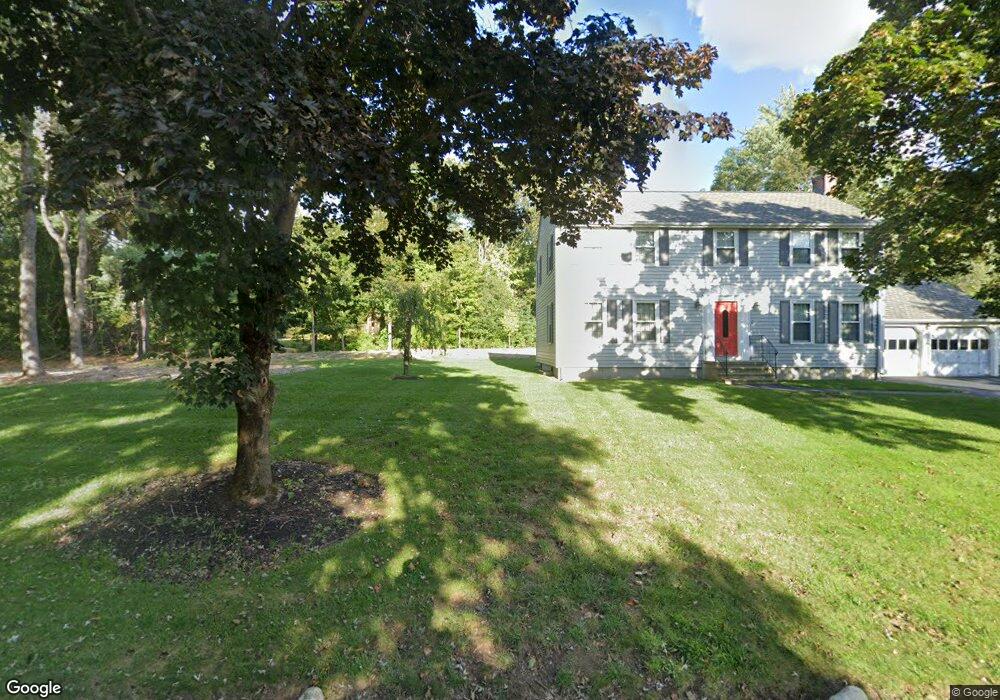
2 Abbot Bridge Dr Andover, MA 01810
Southern Andover NeighborhoodEstimated Value: $1,295,000 - $1,589,000
7
Beds
5
Baths
3,860
Sq Ft
$366/Sq Ft
Est. Value
About This Home
This home is located at 2 Abbot Bridge Dr, Andover, MA 01810 and is currently estimated at $1,411,211, approximately $365 per square foot. 2 Abbot Bridge Dr is a home located in Essex County with nearby schools including South Elementary School, Doherty Middle School, and Andover High School.
Ownership History
Date
Name
Owned For
Owner Type
Purchase Details
Closed on
Mar 18, 2019
Sold by
Foster Cheryl
Bought by
Foster 2019 Ret and Foster
Current Estimated Value
Purchase Details
Closed on
Mar 8, 2019
Sold by
M Foster Abbot Bridge Lt and Foster-Gervacio
Bought by
Foster Cheryl
Purchase Details
Closed on
Jun 16, 2017
Sold by
Foster Margaret E
Bought by
Margaret E Foster Lt and Foster
Create a Home Valuation Report for This Property
The Home Valuation Report is an in-depth analysis detailing your home's value as well as a comparison with similar homes in the area
Home Values in the Area
Average Home Value in this Area
Purchase History
| Date | Buyer | Sale Price | Title Company |
|---|---|---|---|
| Foster 2019 Ret | -- | -- | |
| Foster Cheryl | -- | -- | |
| Margaret E Foster Lt | -- | -- |
Source: Public Records
Tax History
| Year | Tax Paid | Tax Assessment Tax Assessment Total Assessment is a certain percentage of the fair market value that is determined by local assessors to be the total taxable value of land and additions on the property. | Land | Improvement |
|---|---|---|---|---|
| 2024 | $16,072 | $1,247,800 | $673,300 | $574,500 |
| 2023 | $15,458 | $1,131,600 | $611,800 | $519,800 |
| 2022 | $14,774 | $1,011,900 | $547,800 | $464,100 |
| 2021 | $14,224 | $930,300 | $502,900 | $427,400 |
| 2020 | $13,667 | $910,500 | $492,000 | $418,500 |
| 2019 | $0 | $883,200 | $475,100 | $408,100 |
| 2018 | $0 | $827,600 | $451,100 | $376,500 |
| 2017 | $0 | $816,700 | $443,300 | $373,400 |
| 2016 | -- | $816,700 | $443,300 | $373,400 |
| 2015 | -- | $781,300 | $428,400 | $352,900 |
Source: Public Records
Map
Nearby Homes
- 105 Central St
- 3 Torr St
- 100.5 Main St Unit Q
- 96 N Main St Unit 3
- 31 Porter Rd
- 33 Chestnut St Unit 2
- Lot 7 Weeping Willow Dr
- 4 Hammond Way
- 5 Lewis St
- 1 Sweeney Ct
- 11 Rennie Dr
- 53 Salem St
- 52 Salem St
- 2 Powder Mill Square Unit 2B
- 3 West Hollow
- 56 Sunset Rock Rd
- 18 Dale St Unit 9D
- 241 Lowell St Unit 3
- 50C Washington Park Dr Unit 10
- 104 Salem St
- 96 Central St
- 94 Central St
- 6 Abbot Bridge Dr
- 98 Central St
- 98 Central St Unit 1
- 4 Abbot Bridge Dr
- 10 Danforth Cir
- 8 Abbot Bridge Dr
- 8 Danforth Cir
- 92 Central St
- 100 Central St
- 1 Henderson Ave
- 97 Central St
- 7 Danforth Cir
- 101 Central St
- 5 Abbot Bridge Dr
- 95 Central St
- 10 Abbot Bridge Dr
- 6 Danforth Cir
- 7 Abbot Bridge Dr
Your Personal Tour Guide
Ask me questions while you tour the home.