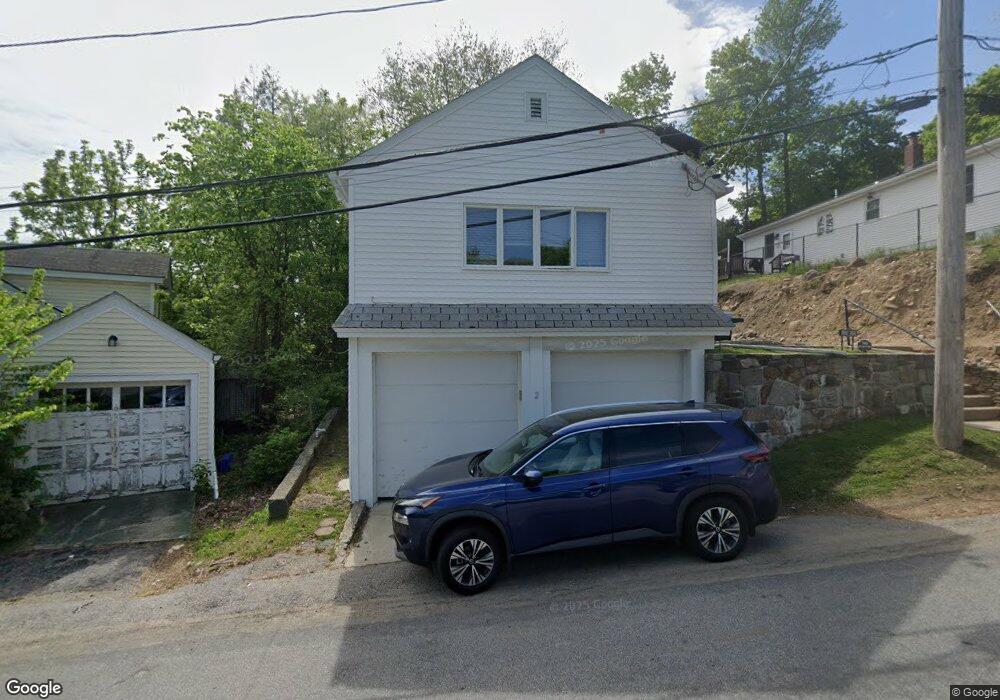
2 Aberdeen St West Warwick, RI 02893
Lippitt-Harris NeighborhoodEstimated Value: $285,000 - $336,000
1
Bed
1
Bath
720
Sq Ft
$440/Sq Ft
Est. Value
About This Home
This home is located at 2 Aberdeen St, West Warwick, RI 02893 and is currently estimated at $316,724, approximately $439 per square foot. 2 Aberdeen St is a home located in Kent County with nearby schools including West Warwick High School, St Joseph School, and Islamic School of Rhode Island.
Ownership History
Date
Name
Owned For
Owner Type
Purchase Details
Closed on
Jan 26, 2026
Sold by
Merida Michael
Bought by
Merida Michael and Merida Josee
Current Estimated Value
Home Financials for this Owner
Home Financials are based on the most recent Mortgage that was taken out on this home.
Original Mortgage
$278,000
Outstanding Balance
$277,732
Interest Rate
6.16%
Mortgage Type
New Conventional
Estimated Equity
$38,992
Purchase Details
Closed on
Apr 12, 2024
Sold by
Merida Michael
Bought by
Merida Michael and Rossi Diane M
Home Financials for this Owner
Home Financials are based on the most recent Mortgage that was taken out on this home.
Original Mortgage
$147,028
Interest Rate
6.88%
Mortgage Type
New Conventional
Create a Home Valuation Report for This Property
The Home Valuation Report is an in-depth analysis detailing your home's value as well as a comparison with similar homes in the area
Home Values in the Area
Average Home Value in this Area
Purchase History
| Date | Buyer | Sale Price | Title Company |
|---|---|---|---|
| Merida Michael | -- | -- | |
| Merida Michael | -- | -- | |
| Merida Michael | -- | None Available | |
| Merida Michael | -- | None Available |
Source: Public Records
Mortgage History
| Date | Status | Borrower | Loan Amount |
|---|---|---|---|
| Open | Merida Michael | $278,000 | |
| Closed | Merida Michael | $278,000 | |
| Previous Owner | Merida Michael | $147,028 |
Source: Public Records
Tax History
| Year | Tax Paid | Tax Assessment Tax Assessment Total Assessment is a certain percentage of the fair market value that is determined by local assessors to be the total taxable value of land and additions on the property. | Land | Improvement |
|---|---|---|---|---|
| 2025 | $3,740 | $261,700 | $96,300 | $165,400 |
| 2024 | $3,269 | $174,900 | $53,100 | $121,800 |
| 2023 | $3,204 | $174,900 | $53,100 | $121,800 |
| 2022 | $3,155 | $174,900 | $53,100 | $121,800 |
| 2021 | $3,137 | $136,400 | $53,100 | $83,300 |
| 2020 | $3,137 | $136,400 | $53,100 | $83,300 |
| 2019 | $3,999 | $136,400 | $53,100 | $83,300 |
| 2018 | $49 | $108,600 | $53,100 | $55,500 |
| 2017 | $2,857 | $108,600 | $53,100 | $55,500 |
| 2016 | $2,806 | $108,600 | $53,100 | $55,500 |
| 2015 | $2,700 | $104,000 | $53,100 | $50,900 |
| 2014 | $2,641 | $104,000 | $53,100 | $50,900 |
Source: Public Records
Map
Nearby Homes
Your Personal Tour Guide
Ask me questions while you tour the home.