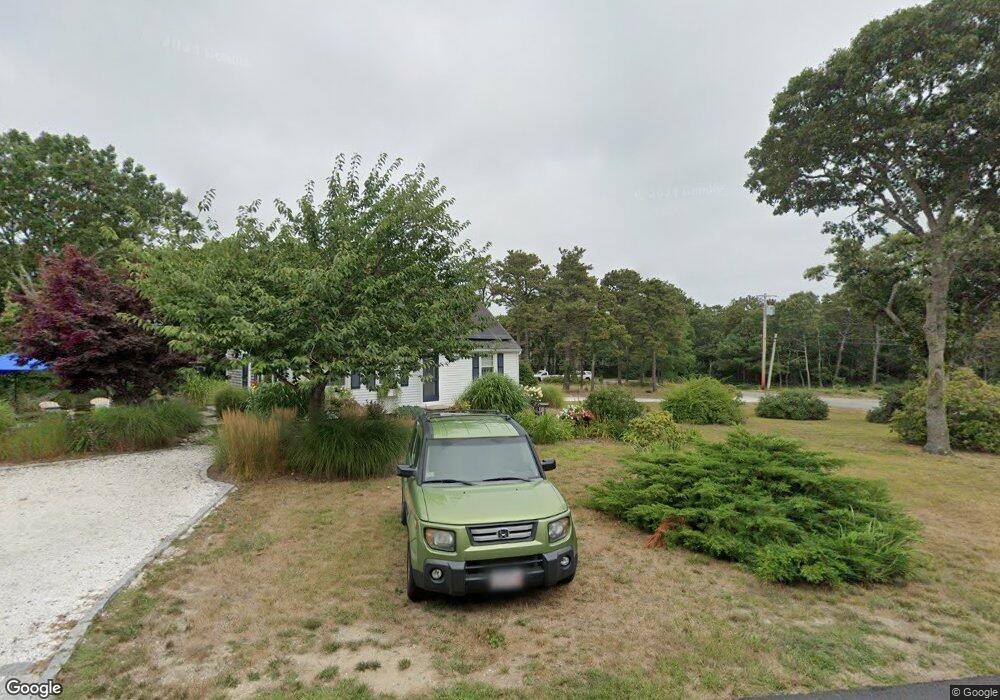
2 Acorn Rd Eastham, MA 02642
Estimated Value: $715,000 - $859,000
About This Home
This home is located at 2 Acorn Rd, Eastham, MA 02642 and is currently estimated at $784,784, approximately $540 per square foot. 2 Acorn Rd is a home located in Barnstable County with nearby schools including Eastham Elementary School, Nauset Regional Middle School, and Nauset Regional High School.
Ownership History
We collect this data history from publicly available records. To have your information removed, we recommend requesting removal directly through your county’s website.
Purchase Details
Purchase Details
Home Financials for this Owner
Home Financials are based on the most recent Mortgage that was taken out on this home.Purchase Details
Home Financials for this Owner
Home Financials are based on the most recent Mortgage that was taken out on this home.Home Values in the Area
Average Home Value in this Area
Purchase History
We collect this data history from publicly available records. To have your information removed, we recommend requesting removal directly through your county’s website.
| Date | Buyer | Sale Price | Title Company |
|---|---|---|---|
| -- | None Available | ||
| -- | None Available | ||
| $429,900 | -- | ||
| $429,900 | -- | ||
| $170,000 | -- | ||
| $170,000 | -- |
Mortgage History
We collect this data history from publicly available records. To have your information removed, we recommend requesting removal directly through your county’s website.
| Date | Status | Borrower | Loan Amount |
|---|---|---|---|
| Previous Owner | $309,000 | ||
| Previous Owner | $325,000 | ||
| Previous Owner | $90,000 |
Tax History
We collect this data history from publicly available records. To have your information removed, we recommend requesting removal directly through your county’s website.
| Year | Tax Paid | Tax Assessment Tax Assessment Total Assessment is a certain percentage of the fair market value that is determined by local assessors to be the total taxable value of land and additions on the property. | Land | Improvement |
|---|---|---|---|---|
| 2025 | $5,086 | $659,600 | $312,600 | $347,000 |
| 2024 | $4,489 | $640,400 | $303,500 | $336,900 |
| 2023 | $4,051 | $559,500 | $281,000 | $278,500 |
| 2022 | $3,855 | $449,300 | $250,900 | $198,400 |
| 2021 | $3,748 | $408,300 | $228,000 | $180,300 |
| 2020 | $3,501 | $401,500 | $232,800 | $168,700 |
| 2019 | $3,216 | $389,800 | $226,000 | $163,800 |
| 2018 | $7,119 | $378,500 | $219,400 | $159,100 |
| 2017 | $2,932 | $371,100 | $215,100 | $156,000 |
| 2016 | $2,532 | $340,300 | $187,000 | $153,300 |
| 2015 | $2,347 | $330,600 | $183,400 | $147,200 |
Map
- 535 School House Rd
- 495 Schoolhouse Rd
- 645 Nauset Rd
- 80 Chipman St
- 10 Alston Ct
- 3 Lighthouse Ln
- 82 Old Orchard Rd
- 3098 State Hwy
- 390 Brackett Rd
- 95 Queen Anne Dr
- 300 Brackett Rd
- 3315 State Hwy
- 21 Locust Rd
- 10 Polly Seabury Way
- 1065 Great Pond Rd
- 255 Epanow Rd
- 245 Nauset Light Rd Unit R
- 325 Nauset Light Beach Rd
- 2560 Nauset Rd
- 65 Whitney Rd
Ask me questions while you tour the home.