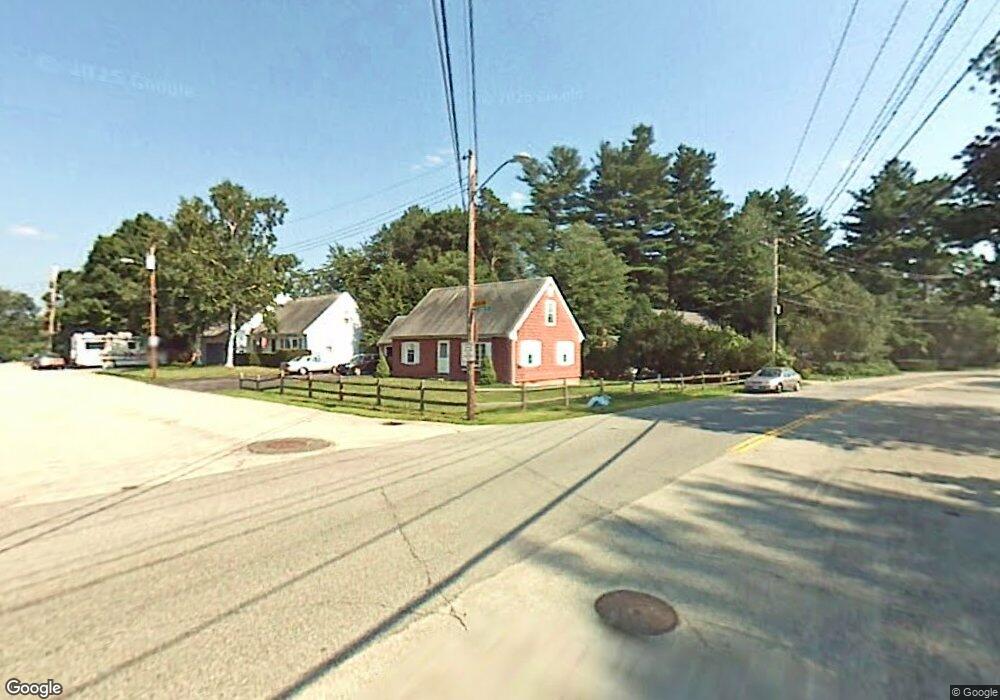
2 Alan St Nashua, NH 03060
South End Nashua NeighborhoodEstimated Value: $441,000 - $473,000
2
Beds
1
Bath
1,531
Sq Ft
$300/Sq Ft
Est. Value
About This Home
This home is located at 2 Alan St, Nashua, NH 03060 and is currently estimated at $458,905, approximately $299 per square foot. 2 Alan St is a home located in Hillsborough County with nearby schools including Fairgrounds Elementary School, Fairgrounds Middle School, and Nashua High School South.
Ownership History
Date
Name
Owned For
Owner Type
Purchase Details
Closed on
Mar 27, 2024
Sold by
Sutcliffe Ft and Sutcliffe
Bought by
Wooster Joshua and Wooster Alexis
Current Estimated Value
Home Financials for this Owner
Home Financials are based on the most recent Mortgage that was taken out on this home.
Original Mortgage
$160,000
Outstanding Balance
$157,256
Interest Rate
6.77%
Mortgage Type
Purchase Money Mortgage
Estimated Equity
$301,649
Purchase Details
Closed on
May 21, 2007
Sold by
Kulas Marion G Est
Bought by
Sutcliffe Brian D and Sutcliffe Lillian A
Home Financials for this Owner
Home Financials are based on the most recent Mortgage that was taken out on this home.
Original Mortgage
$172,800
Interest Rate
6.18%
Mortgage Type
Purchase Money Mortgage
Create a Home Valuation Report for This Property
The Home Valuation Report is an in-depth analysis detailing your home's value as well as a comparison with similar homes in the area
Home Values in the Area
Average Home Value in this Area
Purchase History
| Date | Buyer | Sale Price | Title Company |
|---|---|---|---|
| Wooster Joshua | $180,000 | None Available | |
| Wooster Joshua | $180,000 | None Available | |
| Sutcliffe Brian D | $216,000 | -- | |
| Sutcliffe Brian D | $216,000 | -- |
Source: Public Records
Mortgage History
| Date | Status | Borrower | Loan Amount |
|---|---|---|---|
| Open | Wooster Joshua | $160,000 | |
| Closed | Wooster Joshua | $160,000 | |
| Previous Owner | Sutcliffe Brian D | $190,000 | |
| Previous Owner | Sutcliffe Brian D | $172,800 |
Source: Public Records
Tax History Compared to Growth
Tax History
| Year | Tax Paid | Tax Assessment Tax Assessment Total Assessment is a certain percentage of the fair market value that is determined by local assessors to be the total taxable value of land and additions on the property. | Land | Improvement |
|---|---|---|---|---|
| 2024 | $6,546 | $411,700 | $155,400 | $256,300 |
| 2023 | $6,164 | $338,100 | $124,300 | $213,800 |
| 2022 | $6,109 | $338,100 | $124,300 | $213,800 |
| 2021 | $5,396 | $232,400 | $82,900 | $149,500 |
| 2020 | $5,070 | $234,100 | $82,900 | $151,200 |
| 2019 | $5,000 | $234,100 | $82,900 | $151,200 |
| 2018 | $4,965 | $234,100 | $82,900 | $151,200 |
| 2017 | $5,233 | $202,900 | $64,200 | $138,700 |
| 2016 | $4,644 | $202,900 | $64,200 | $138,700 |
| 2015 | $4,977 | $202,900 | $64,200 | $138,700 |
| 2014 | $4,880 | $202,900 | $64,200 | $138,700 |
Source: Public Records
Map
Nearby Homes
- 63 Dexter St
- 97 Linwood St
- 22 Kern Dr
- 30 Gingras Dr
- 6 Hayden St
- 17 Herrick St
- 15 Learned St Unit 123
- 15 Lovell St Unit 3
- 15 Lovell St Unit 7
- 15 Lovell St Unit 10
- 11 Bordeaux St
- 36 Eastman St Unit 26
- 29 Greenwood Dr
- 2 Wakefield Dr
- 22 New Dunstable Rd Unit 132133
- 22 Wilder St
- 41 New Dunstable Rd Unit 371
- 169A W Hollis St Unit 193
- 4 Badger St
- 27 Fifield St Unit 13