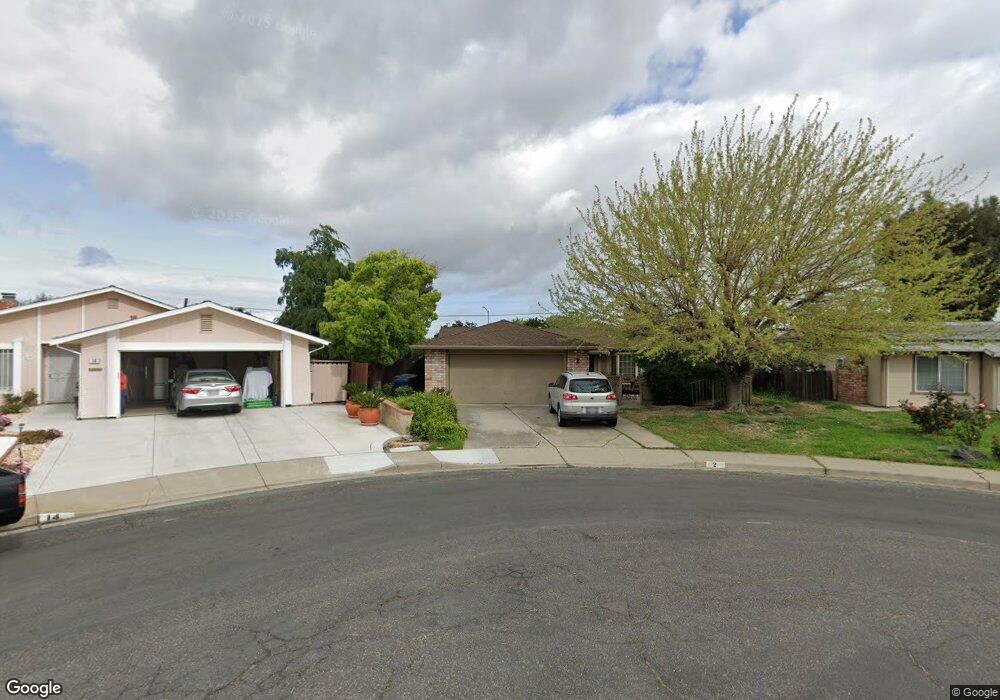
2 Argosy Ct Pittsburg, CA 94565
Woodland Hills NeighborhoodEstimated Value: $426,000 - $488,000
3
Beds
1
Bath
930
Sq Ft
$499/Sq Ft
Est. Value
About This Home
This home is located at 2 Argosy Ct, Pittsburg, CA 94565 and is currently estimated at $464,022, approximately $498 per square foot. 2 Argosy Ct is a home located in Contra Costa County with nearby schools including Willow Cove Elementary School, Rancho Medanos Junior High School, and Pittsburg Senior High School.
Ownership History
Date
Name
Owned For
Owner Type
Purchase Details
Closed on
Oct 25, 2002
Sold by
Ferry Robert S and Ferry Virginia M
Bought by
Espinoza Loretta M
Current Estimated Value
Home Financials for this Owner
Home Financials are based on the most recent Mortgage that was taken out on this home.
Original Mortgage
$193,600
Outstanding Balance
$85,204
Interest Rate
7.25%
Mortgage Type
Purchase Money Mortgage
Estimated Equity
$378,818
Purchase Details
Closed on
May 14, 1999
Sold by
Morris Virginia M and Morris Virginia M
Bought by
Ferry Robert S and Ferry Virginia M
Purchase Details
Closed on
Dec 1, 1993
Sold by
Morris Virginia M
Bought by
Morris Virginia M
Home Financials for this Owner
Home Financials are based on the most recent Mortgage that was taken out on this home.
Original Mortgage
$101,600
Interest Rate
5.12%
Mortgage Type
Purchase Money Mortgage
Create a Home Valuation Report for This Property
The Home Valuation Report is an in-depth analysis detailing your home's value as well as a comparison with similar homes in the area
Home Values in the Area
Average Home Value in this Area
Purchase History
| Date | Buyer | Sale Price | Title Company |
|---|---|---|---|
| Espinoza Loretta M | $242,000 | American Title | |
| Ferry Robert S | -- | -- | |
| Morris Virginia M | -- | Chicago Title Company |
Source: Public Records
Mortgage History
| Date | Status | Borrower | Loan Amount |
|---|---|---|---|
| Open | Espinoza Loretta M | $193,600 | |
| Previous Owner | Morris Virginia M | $101,600 | |
| Closed | Espinoza Loretta M | $48,400 |
Source: Public Records
Tax History
| Year | Tax Paid | Tax Assessment Tax Assessment Total Assessment is a certain percentage of the fair market value that is determined by local assessors to be the total taxable value of land and additions on the property. | Land | Improvement |
|---|---|---|---|---|
| 2025 | $4,625 | $350,474 | $181,029 | $169,445 |
| 2024 | $4,393 | $343,603 | $177,480 | $166,123 |
| 2023 | $4,431 | $336,866 | $174,000 | $162,866 |
| 2022 | $4,493 | $330,262 | $170,589 | $159,673 |
| 2021 | $4,493 | $323,788 | $167,245 | $156,543 |
| 2019 | $4,281 | $314,186 | $162,286 | $151,900 |
| 2018 | $4,119 | $308,026 | $159,104 | $148,922 |
| 2017 | $3,886 | $284,500 | $146,952 | $137,548 |
| 2016 | $3,114 | $234,500 | $121,126 | $113,374 |
| 2015 | $2,857 | $198,000 | $102,273 | $95,727 |
| 2014 | $2,390 | $162,500 | $83,936 | $78,564 |
Source: Public Records
Map
Nearby Homes
- 1191 Red Leaf Way
- 27 Loftus Rd
- 0 Mountain View Ave
- 24 Mountain View Ave
- 1526 Willow Pass Rd Unit 16
- 2 Viking Way
- 68 - 76 Bayview Ave
- 61 Galleon Way
- 179 Crivello Ave
- 168 Loftus Rd
- 79 Bella Vista Ave
- 346 Melanie Dr
- 191 Maureen Cir
- 64 N Bella Monte Ave
- 64 S Bella Monte Ave
- 2120 Sugartree Dr
- 1988 Calaveras Dr
- 8 Emerson Ct
- 1998 Calaveras Dr
- 58 Solano Ave
Your Personal Tour Guide
Ask me questions while you tour the home.