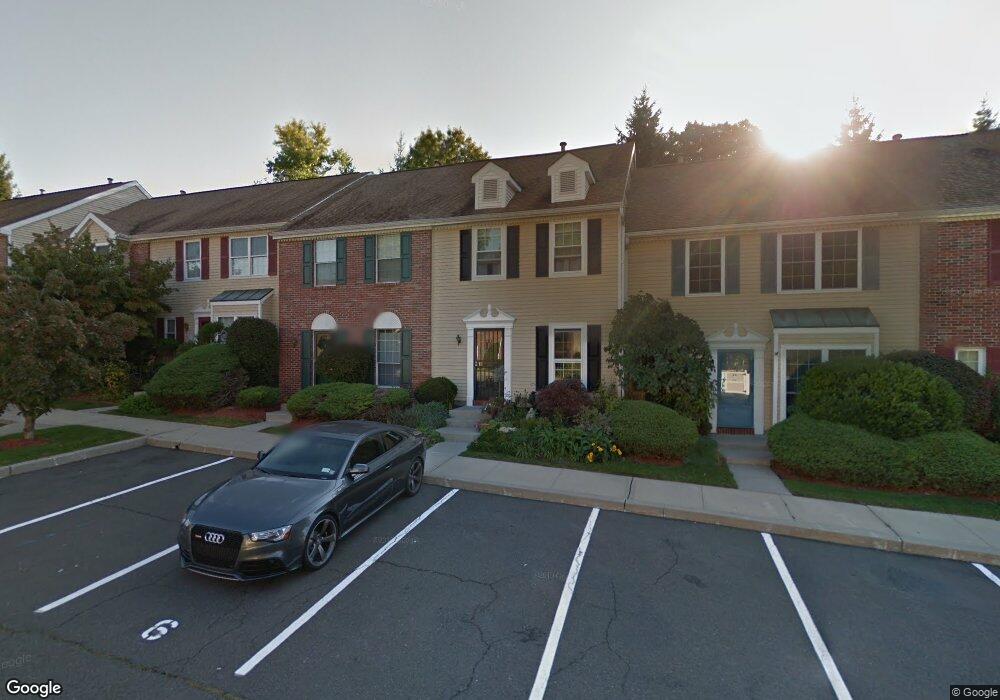
2 Ashdown Ct Unit 15B Peekskill, NY 10566
Estimated Value: $394,000 - $584,000
Studio
--
Bath
--
Sq Ft
436
Sq Ft Lot
About This Home
This home is located at 2 Ashdown Ct Unit 15B, Peekskill, NY 10566 and is currently estimated at $488,069. 2 Ashdown Ct Unit 15B is a home located in Westchester County with nearby schools including Hillcrest School, Oakside School, and Woodside Elementary School.
Ownership History
Date
Name
Owned For
Owner Type
Purchase Details
Closed on
Jan 9, 2018
Sold by
Moore Everard
Bought by
Moore Everard and Butler Moore Cherryl M
Current Estimated Value
Purchase Details
Closed on
Feb 15, 2007
Sold by
Murphy Daniel
Bought by
Moore Everard
Purchase Details
Closed on
Dec 17, 2002
Sold by
Phipps Bruce H and Phipps Sharon D
Bought by
Murphy Daniel X
Home Financials for this Owner
Home Financials are based on the most recent Mortgage that was taken out on this home.
Original Mortgage
$200,000
Interest Rate
5.95%
Mortgage Type
Unknown
Purchase Details
Closed on
Nov 24, 1999
Sold by
Herbage Theodore D
Bought by
Phipps Bruce H and Phipps Sharon D
Home Financials for this Owner
Home Financials are based on the most recent Mortgage that was taken out on this home.
Original Mortgage
$137,750
Interest Rate
7.86%
Purchase Details
Closed on
Aug 2, 1995
Sold by
Oci Mtg Corp
Bought by
Herbage Theodore D
Create a Home Valuation Report for This Property
The Home Valuation Report is an in-depth analysis detailing your home's value as well as a comparison with similar homes in the area
Home Values in the Area
Average Home Value in this Area
Purchase History
| Date | Buyer | Sale Price | Title Company |
|---|---|---|---|
| Moore Everard | -- | Title Sources | |
| Moore Everard | $360,000 | Tristate Title Agency Llc | |
| Murphy Daniel X | $265,000 | The Judicial Title Ins Agenc | |
| Phipps Bruce H | $145,000 | -- | |
| Herbage Theodore D | $111,000 | Commonwealth Land Title Ins |
Source: Public Records
Mortgage History
| Date | Status | Borrower | Loan Amount |
|---|---|---|---|
| Previous Owner | Murphy Daniel X | $200,000 | |
| Previous Owner | Phipps Bruce H | $137,750 |
Source: Public Records
Tax History
| Year | Tax Paid | Tax Assessment Tax Assessment Total Assessment is a certain percentage of the fair market value that is determined by local assessors to be the total taxable value of land and additions on the property. | Land | Improvement |
|---|---|---|---|---|
| 2024 | $6,119 | $8,100 | $1,500 | $6,600 |
| 2023 | $8,191 | $8,100 | $1,500 | $6,600 |
| 2022 | $7,994 | $8,100 | $1,500 | $6,600 |
| 2021 | $9,516 | $8,100 | $1,500 | $6,600 |
| 2020 | $7,272 | $8,100 | $1,500 | $6,600 |
| 2019 | $6,865 | $8,100 | $1,500 | $6,600 |
| 2018 | $3,481 | $8,100 | $1,500 | $6,600 |
| 2017 | $3,679 | $8,100 | $1,500 | $6,600 |
| 2016 | $5,966 | $8,100 | $1,500 | $6,600 |
| 2015 | $3,103 | $8,100 | $1,500 | $6,600 |
| 2014 | $3,103 | $8,100 | $1,500 | $6,600 |
| 2013 | $3,103 | $8,100 | $1,500 | $6,600 |
Source: Public Records
Map
Nearby Homes
- 31 Winchester Ave
- 8 Cumberland Ct
- 23 Nottingham Cir
- 4 Nottingham Cir
- 20 Beecher Ln
- 192 Benefield Blvd
- 63 Waterbury Pkwy
- 104 Mallard Way
- 1840 Crompond Rd Unit 2C2
- 1840 Crompond Rd Unit 2A3
- 1840 Crompond Rd Unit 7B8
- 1840 Crompond Rd Unit 4A3
- 1840 Crompond Rd Unit 7C6
- 1840 Crompond Rd Unit 5C8
- 1840 Crompond Rd Unit 9A6
- 1840 Crompond Rd Unit 9B7
- 102 Ridge Rd
- 69 Locust Ave
- 1824 Seabury Place
- 6 Highland Dr
- 36 Winchester Ave Unit 8G
- 38 Winchester Ave Unit 8F
- 40 Winchester Ave
- 48 Winchester Ave Unit 8A
- 67 Winchester Ave
- 22 Winchester Ave Unit 6F
- 26 Winchester Ave Unit 6D
- 37 Winchester Ave Unit 3C
- 27 Winchester Ave
- 15 Winchester Ave Unit 2A
- 4 Ashdown Ct
- 1 Ashdown Ct
- 53 Campus Rd Unit 13B
- 51 Campus Rd Unit 13A
- 5 Winchester Ave
- 31 Huntington Cir Unit 31
- 95 Winchester Ave
- 35 Winchester Ave
- 38 Edinburgh Dr
- 31 Huntington Cir
Your Personal Tour Guide
Ask me questions while you tour the home.