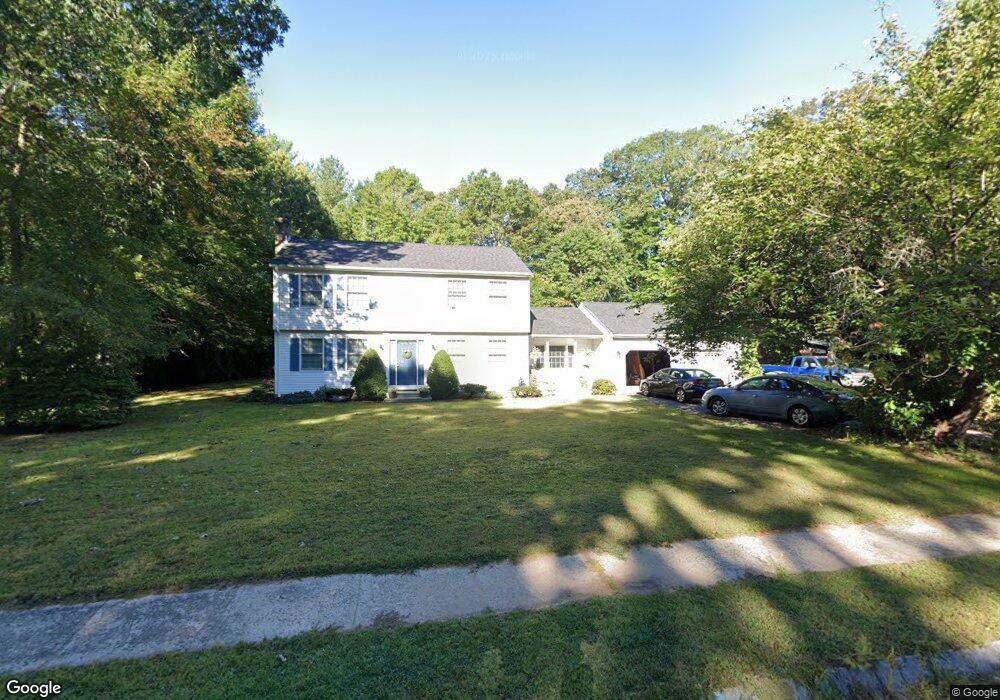
2 Autumn Dr Enfield, CT 06082
Estimated Value: $444,000 - $538,000
3
Beds
2
Baths
2,060
Sq Ft
$239/Sq Ft
Est. Value
About This Home
This home is located at 2 Autumn Dr, Enfield, CT 06082 and is currently estimated at $492,963, approximately $239 per square foot. 2 Autumn Dr is a home located in Hartford County with nearby schools including Edgar H. Parkman School, Enfield Street Elementary School, and John F. Kennedy Middle School.
Ownership History
Date
Name
Owned For
Owner Type
Purchase Details
Closed on
Mar 31, 2006
Sold by
Ho Autumn Fields Somer
Bought by
Joshi Vijay and Joshi Nila
Current Estimated Value
Home Financials for this Owner
Home Financials are based on the most recent Mortgage that was taken out on this home.
Original Mortgage
$292,000
Outstanding Balance
$149,167
Interest Rate
4.49%
Estimated Equity
$343,796
Purchase Details
Closed on
Dec 19, 1990
Sold by
Leaska Const
Bought by
Rund Raymond
Create a Home Valuation Report for This Property
The Home Valuation Report is an in-depth analysis detailing your home's value as well as a comparison with similar homes in the area
Home Values in the Area
Average Home Value in this Area
Purchase History
| Date | Buyer | Sale Price | Title Company |
|---|---|---|---|
| Joshi Vijay | $371,445 | -- | |
| Rund Raymond | $163,400 | -- |
Source: Public Records
Mortgage History
| Date | Status | Borrower | Loan Amount |
|---|---|---|---|
| Open | Rund Raymond | $292,000 | |
| Previous Owner | Rund Raymond | $120,000 | |
| Previous Owner | Rund Raymond | $12,000 | |
| Previous Owner | Rund Raymond | $122,000 |
Source: Public Records
Tax History Compared to Growth
Tax History
| Year | Tax Paid | Tax Assessment Tax Assessment Total Assessment is a certain percentage of the fair market value that is determined by local assessors to be the total taxable value of land and additions on the property. | Land | Improvement |
|---|---|---|---|---|
| 2025 | $8,051 | $230,100 | $67,300 | $162,800 |
| 2024 | $7,835 | $230,100 | $67,300 | $162,800 |
| 2023 | $7,771 | $229,900 | $67,300 | $162,600 |
| 2022 | $7,056 | $229,900 | $67,300 | $162,600 |
| 2021 | $7,083 | $188,740 | $57,900 | $130,840 |
| 2020 | $7,083 | $188,740 | $57,900 | $130,840 |
| 2019 | $7,102 | $188,740 | $57,900 | $130,840 |
| 2018 | $6,983 | $188,740 | $57,900 | $130,840 |
| 2017 | $6,593 | $188,740 | $57,900 | $130,840 |
| 2016 | $6,203 | $180,780 | $57,900 | $122,880 |
| 2015 | $6,009 | $180,780 | $57,900 | $122,880 |
| 2014 | $5,854 | $180,780 | $57,900 | $122,880 |
Source: Public Records
Map
Nearby Homes