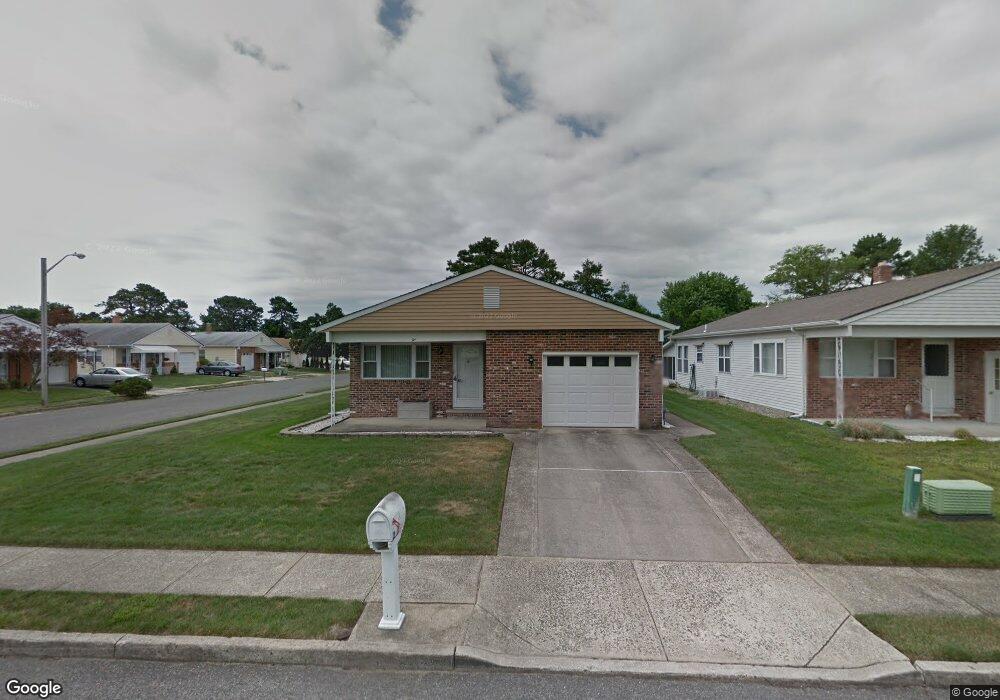
2 Bedivere Ct Toms River, NJ 08757
Estimated Value: $377,251 - $394,000
2
Beds
2
Baths
1,232
Sq Ft
$311/Sq Ft
Est. Value
About This Home
This home is located at 2 Bedivere Ct, Toms River, NJ 08757 and is currently estimated at $383,063, approximately $310 per square foot. 2 Bedivere Ct is a home located in Ocean County with nearby schools including Central Regional Middle School and Central Regional High School.
Ownership History
Date
Name
Owned For
Owner Type
Purchase Details
Closed on
Mar 19, 2019
Sold by
Dhir Sunil
Bought by
Pierce Michele
Current Estimated Value
Home Financials for this Owner
Home Financials are based on the most recent Mortgage that was taken out on this home.
Original Mortgage
$140,000
Outstanding Balance
$123,084
Interest Rate
4.4%
Mortgage Type
New Conventional
Estimated Equity
$259,979
Purchase Details
Closed on
Oct 1, 2018
Sold by
Insabella John F and Insabella John
Bought by
Dhir Sunil
Purchase Details
Closed on
Oct 30, 2001
Sold by
Tozzi Ralph
Bought by
Insabella John
Home Financials for this Owner
Home Financials are based on the most recent Mortgage that was taken out on this home.
Original Mortgage
$92,000
Interest Rate
6.7%
Create a Home Valuation Report for This Property
The Home Valuation Report is an in-depth analysis detailing your home's value as well as a comparison with similar homes in the area
Home Values in the Area
Average Home Value in this Area
Purchase History
| Date | Buyer | Sale Price | Title Company |
|---|---|---|---|
| Pierce Michele | $250,000 | Trident Abstract Ttl Agcy Ll | |
| Dhir Sunil | $130,000 | None Available | |
| Insabella John | $116,900 | -- |
Source: Public Records
Mortgage History
| Date | Status | Borrower | Loan Amount |
|---|---|---|---|
| Open | Pierce Michele | $140,000 | |
| Previous Owner | Insabella John | $92,000 |
Source: Public Records
Tax History Compared to Growth
Tax History
| Year | Tax Paid | Tax Assessment Tax Assessment Total Assessment is a certain percentage of the fair market value that is determined by local assessors to be the total taxable value of land and additions on the property. | Land | Improvement |
|---|---|---|---|---|
| 2025 | $4,571 | $189,600 | $30,000 | $159,600 |
| 2024 | $4,399 | $189,600 | $30,000 | $159,600 |
| 2023 | $4,317 | $189,600 | $30,000 | $159,600 |
| 2022 | $4,317 | $189,600 | $30,000 | $159,600 |
| 2021 | $4,226 | $189,600 | $30,000 | $159,600 |
| 2020 | $4,226 | $189,600 | $30,000 | $159,600 |
| 2019 | $2,535 | $117,000 | $30,000 | $87,000 |
| 2018 | $2,527 | $117,000 | $30,000 | $87,000 |
| 2017 | $2,434 | $117,000 | $30,000 | $87,000 |
| 2016 | $2,421 | $117,000 | $30,000 | $87,000 |
| 2015 | $2,354 | $117,000 | $30,000 | $87,000 |
| 2014 | $2,287 | $117,000 | $30,000 | $87,000 |
Source: Public Records
Map
Nearby Homes
- 14 Bedivere Ct
- 11 Inverell Dr
- 39 Innsbruck Dr
- 8 Augusta Ct
- 4 Augusta Ct
- 380 Port Royal Dr
- 6 Redlands Ct
- 65 Innsbruck Dr
- 25 Purnell St
- 11 La Terraza Dr
- 70 Innsbruck Dr
- 8 La Terraza Dr
- 12 San Jacinto St
- 289 Costa Mesa Dr
- 3 Muirhead St
- 1 Lagos Ct
- 5 Saint Andrews Ct
- 23 Fontana St
- 15 Encinitas Dr
- 7 Bordeaux Ct