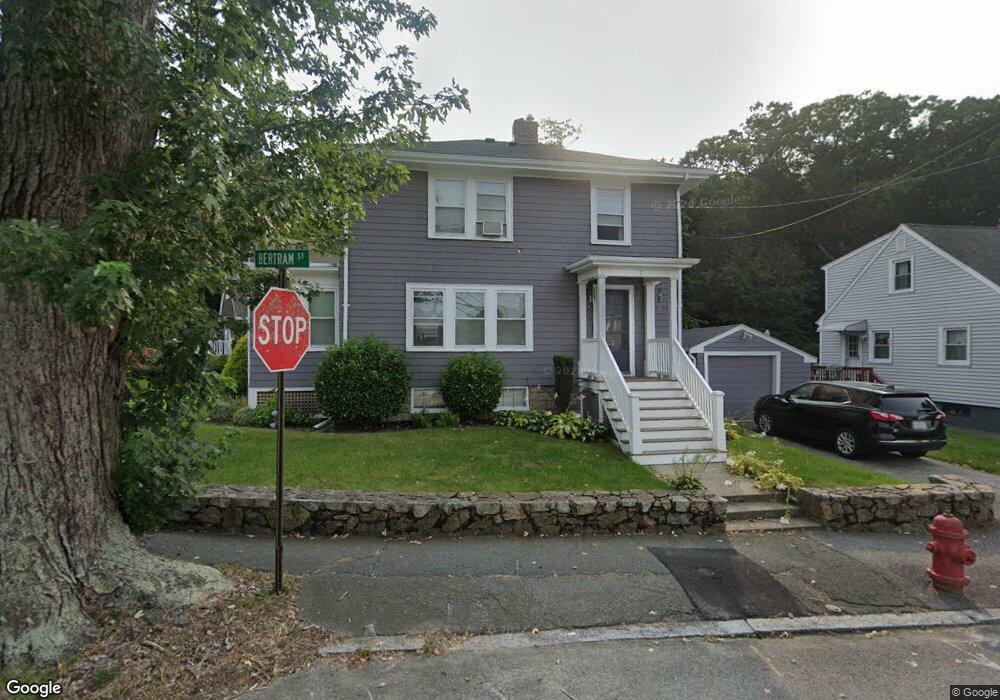
2 Bertram St Beverly, MA 01915
Downtown Beverly NeighborhoodEstimated Value: $831,685 - $922,000
3
Beds
2
Baths
1,576
Sq Ft
$556/Sq Ft
Est. Value
About This Home
This home is located at 2 Bertram St, Beverly, MA 01915 and is currently estimated at $875,671, approximately $555 per square foot. 2 Bertram St is a home located in Essex County with nearby schools including Beverly High School, Harborlight Montessori School, and Mrs Alexander's School.
Ownership History
Date
Name
Owned For
Owner Type
Purchase Details
Closed on
Aug 19, 2011
Sold by
Fhlmc
Bought by
Leiton-Vega Christopher and Marnik Rachel
Current Estimated Value
Home Financials for this Owner
Home Financials are based on the most recent Mortgage that was taken out on this home.
Original Mortgage
$304,000
Outstanding Balance
$207,959
Interest Rate
4.62%
Mortgage Type
Purchase Money Mortgage
Estimated Equity
$667,712
Purchase Details
Closed on
Sep 20, 2010
Sold by
Jones Nancy L and Bac Home Loans Svcng L
Bought by
Fhlmc
Purchase Details
Closed on
Nov 10, 2006
Sold by
Panzero Michael
Bought by
Jones Nancy L
Home Financials for this Owner
Home Financials are based on the most recent Mortgage that was taken out on this home.
Original Mortgage
$364,500
Interest Rate
6.31%
Mortgage Type
Purchase Money Mortgage
Purchase Details
Closed on
Feb 18, 2005
Sold by
Annese Christine H and Varrell Sheila A
Bought by
Panzero Michael
Create a Home Valuation Report for This Property
The Home Valuation Report is an in-depth analysis detailing your home's value as well as a comparison with similar homes in the area
Home Values in the Area
Average Home Value in this Area
Purchase History
| Date | Buyer | Sale Price | Title Company |
|---|---|---|---|
| Leiton-Vega Christopher | $320,000 | -- | |
| Fhlmc | $291,600 | -- | |
| Jones Nancy L | $376,000 | -- | |
| Panzero Michael | $300,000 | -- |
Source: Public Records
Mortgage History
| Date | Status | Borrower | Loan Amount |
|---|---|---|---|
| Open | Panzero Michael | $304,000 | |
| Previous Owner | Panzero Michael | $364,500 | |
| Previous Owner | Panzero Michael | $600,000 |
Source: Public Records
Tax History
| Year | Tax Paid | Tax Assessment Tax Assessment Total Assessment is a certain percentage of the fair market value that is determined by local assessors to be the total taxable value of land and additions on the property. | Land | Improvement |
|---|---|---|---|---|
| 2025 | $7,473 | $680,000 | $435,800 | $244,200 |
| 2024 | $7,010 | $624,200 | $380,000 | $244,200 |
| 2023 | $6,713 | $596,200 | $352,000 | $244,200 |
| 2022 | $6,349 | $521,700 | $277,500 | $244,200 |
| 2021 | $6,157 | $484,800 | $264,500 | $220,300 |
| 2020 | $5,850 | $460,600 | $240,300 | $220,300 |
| 2019 | $5,724 | $433,300 | $219,800 | $213,500 |
| 2018 | $5,566 | $409,300 | $214,200 | $195,100 |
| 2017 | $5,446 | $381,400 | $186,300 | $195,100 |
| 2016 | $5,032 | $349,700 | $154,600 | $195,100 |
| 2015 | $4,934 | $349,700 | $154,600 | $195,100 |
Source: Public Records
Map
Nearby Homes
- 94 Essex St
- 42 Bisson St
- 68 Paine Ave
- 16 Jewett Rd
- 40 Heather St Unit 204
- 6 Charles St
- 9 Swan St Unit 2
- 412 Cabot St
- The Cabot Collection
- 34 Chase St
- 17 Pond St
- 348 Rantoul St Unit 202
- 315 Rantoul St Unit 406
- 3 Elm Top Ln
- 4 Pinewood Ave
- 261 Rantoul St
- 11 Pickman Rd
- 98 Northridge Rd Unit 98
- 50 Balch St Unit 300
- 50 Balch St Unit 205
Your Personal Tour Guide
Ask me questions while you tour the home.