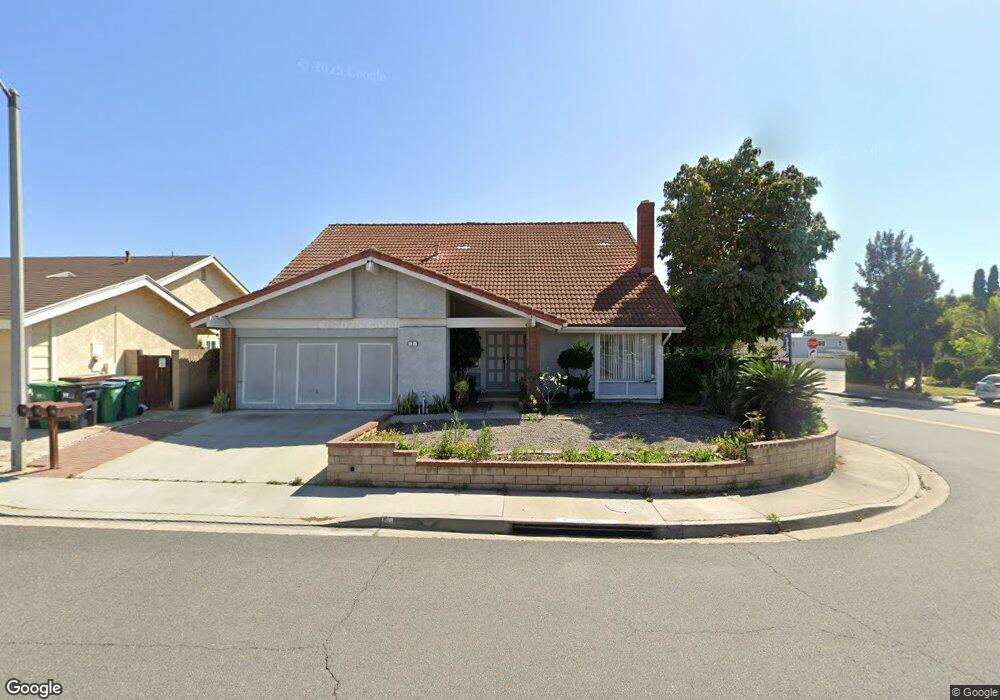
2 Bunker Hill Irvine, CA 92620
Northwood NeighborhoodEstimated Value: $1,645,000 - $1,979,000
4
Beds
3
Baths
2,203
Sq Ft
$825/Sq Ft
Est. Value
About This Home
This home is located at 2 Bunker Hill, Irvine, CA 92620 and is currently estimated at $1,817,742, approximately $825 per square foot. 2 Bunker Hill is a home located in Orange County with nearby schools including Brywood Elementary School, Sierra Vista Middle School, and Northwood High School.
Ownership History
Date
Name
Owned For
Owner Type
Purchase Details
Closed on
Jun 11, 2010
Sold by
Do Hung Ngoc and Do Lien Thi
Bought by
Do Hung Ngoc and Do Lien Thi
Current Estimated Value
Purchase Details
Closed on
Nov 25, 1996
Sold by
State Street Bank & Trust Company
Bought by
Do Hung Ngoc and Do Lien Thi
Home Financials for this Owner
Home Financials are based on the most recent Mortgage that was taken out on this home.
Original Mortgage
$100,000
Interest Rate
7.91%
Purchase Details
Closed on
Jul 8, 1996
Sold by
Ramanlal Patel Hemant and Ramanlal Kumud H
Bought by
State Street Bank & Trust Company and Mortgage Pass Through Certificates Serie
Create a Home Valuation Report for This Property
The Home Valuation Report is an in-depth analysis detailing your home's value as well as a comparison with similar homes in the area
Home Values in the Area
Average Home Value in this Area
Purchase History
| Date | Buyer | Sale Price | Title Company |
|---|---|---|---|
| Do Hung Ngoc | -- | None Available | |
| Do Hung Ngoc | $230,000 | Continental Lawyers Title Co | |
| State Street Bank & Trust Company | $222,462 | -- |
Source: Public Records
Mortgage History
| Date | Status | Borrower | Loan Amount |
|---|---|---|---|
| Closed | Do Hung Ngoc | $100,000 |
Source: Public Records
Tax History
| Year | Tax Paid | Tax Assessment Tax Assessment Total Assessment is a certain percentage of the fair market value that is determined by local assessors to be the total taxable value of land and additions on the property. | Land | Improvement |
|---|---|---|---|---|
| 2025 | $3,950 | $374,588 | $148,840 | $225,748 |
| 2024 | $3,950 | $367,244 | $145,922 | $221,322 |
| 2023 | $3,847 | $360,044 | $143,061 | $216,983 |
| 2022 | $3,768 | $352,985 | $140,256 | $212,729 |
| 2021 | $3,678 | $346,064 | $137,506 | $208,558 |
| 2020 | $3,657 | $342,516 | $136,096 | $206,420 |
| 2019 | $3,575 | $335,800 | $133,427 | $202,373 |
| 2018 | $3,509 | $329,216 | $130,811 | $198,405 |
| 2017 | $3,435 | $322,761 | $128,246 | $194,515 |
| 2016 | $3,285 | $316,433 | $125,732 | $190,701 |
| 2015 | $3,236 | $311,680 | $123,843 | $187,837 |
| 2014 | $3,173 | $305,575 | $121,417 | $184,158 |
Source: Public Records
Map
Nearby Homes
Your Personal Tour Guide
Ask me questions while you tour the home.