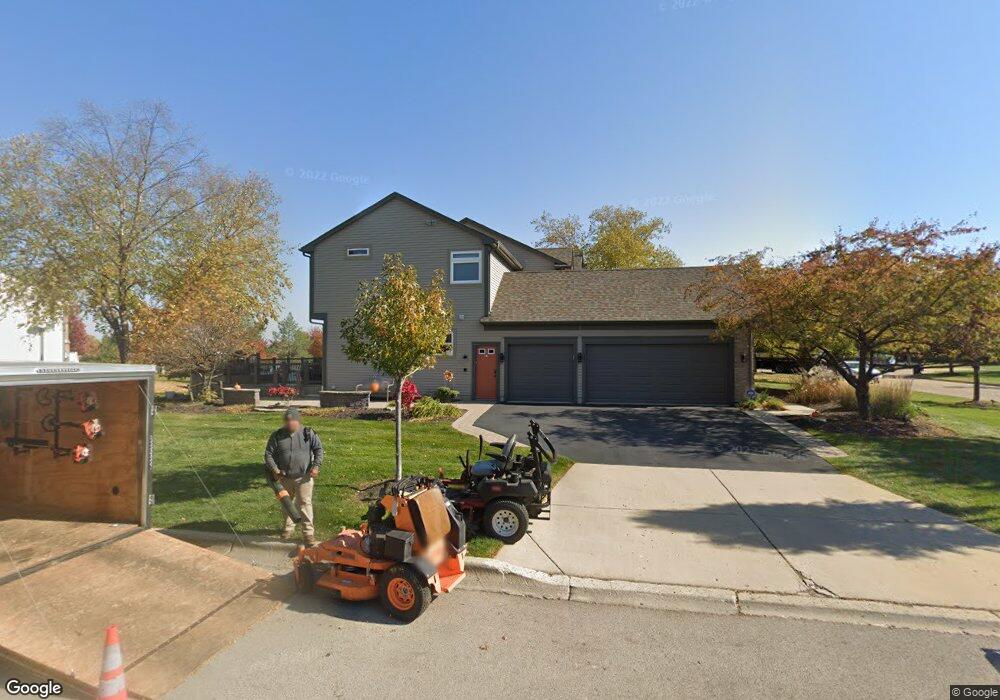
2 Camberwell Ct Algonquin, IL 60102
Far West Algonquin NeighborhoodEstimated Value: $488,871 - $556,000
Studio
--
Bath
2,603
Sq Ft
$202/Sq Ft
Est. Value
About This Home
This home is located at 2 Camberwell Ct, Algonquin, IL 60102 and is currently estimated at $525,718, approximately $201 per square foot. 2 Camberwell Ct is a home located in McHenry County with nearby schools including Mackeben Elementary School, Conley Elementary School, and Heineman Middle School.
Ownership History
Date
Name
Owned For
Owner Type
Purchase Details
Closed on
Aug 26, 2014
Sold by
Digangi Joseph
Bought by
Digangi Deborah F and Saad Deborah F
Current Estimated Value
Purchase Details
Closed on
Sep 13, 2000
Sold by
Pulte Home Corp
Bought by
Digangi Joseph and Saad Deborah F
Home Financials for this Owner
Home Financials are based on the most recent Mortgage that was taken out on this home.
Original Mortgage
$308,430
Outstanding Balance
$112,730
Interest Rate
8.14%
Estimated Equity
$412,988
Create a Home Valuation Report for This Property
The Home Valuation Report is an in-depth analysis detailing your home's value as well as a comparison with similar homes in the area
Home Values in the Area
Average Home Value in this Area
Purchase History
| Date | Buyer | Sale Price | Title Company |
|---|---|---|---|
| Digangi Deborah F | -- | None Available | |
| Digangi Joseph | $343,525 | First American |
Source: Public Records
Mortgage History
| Date | Status | Borrower | Loan Amount |
|---|---|---|---|
| Open | Digangi Joseph | $308,430 |
Source: Public Records
Tax History
| Year | Tax Paid | Tax Assessment Tax Assessment Total Assessment is a certain percentage of the fair market value that is determined by local assessors to be the total taxable value of land and additions on the property. | Land | Improvement |
|---|---|---|---|---|
| 2024 | $9,707 | $150,869 | $9,783 | $141,086 |
| 2023 | $9,370 | $135,527 | $8,788 | $126,739 |
| 2022 | $9,107 | $123,408 | $8,002 | $115,406 |
| 2021 | $8,785 | $116,225 | $7,536 | $108,689 |
| 2020 | $8,643 | $113,125 | $7,335 | $105,790 |
| 2019 | $8,407 | $110,237 | $7,148 | $103,089 |
| 2018 | $8,949 | $115,077 | $8,044 | $107,033 |
| 2017 | $9,200 | $108,451 | $7,581 | $100,870 |
| 2016 | $9,298 | $103,110 | $7,208 | $95,902 |
| 2013 | -- | $98,284 | $14,651 | $83,633 |
Source: Public Records
Map
Nearby Homes
- 9105 Algonquin Rd
- 430 Tuscany Dr
- 6 Sugar Maple Ct
- 9 Annandale Ct
- 11290 Wildridge Ln
- 940 Treeline Dr
- 11320 Wildridge Ln
- 4241 Wanderlust Dr
- 121 Boulder Dr
- 9956 Edgebrook Ln
- 9937 Edgebrook Ln
- 531 Alpine Dr
- 9966 Edgebrook Ln
- 9947 Edgebrook Ln
- 9976 Edgebrook Ln
- 9957 Edgebrook Ln
- 9986 Edgebrook Ln
- 9967 Edgebrook Ln
- 11371 Wildridge Ln
- 9977 Edgebrook Ln
- 4 Camberwell Ct
- 4720 Whitehall Ct
- 0000 Cumberland Pkwy
- 4641 Whitehall Ct
- 4611 Whitehall Ct
- 4710 Whitehall Ct
- 4730 Whitehall Ct
- 4700 Whitehall Ct
- 0001 Cumberland and Chase Pkwy
- 4740 Whitehall Ct
- 4690 Whitehall Ct
- 3 Camberwell Ct
- 8 Camberwell Ct
- 4601 Whitehall Ct
- 4651 Whitehall Ct
- 5 Camberwell Ct
- 7 Camberwell Ct
- 4680 Whitehall Ct
- 4750 Whitehall Ct
- 4591 Whitehall Ct
Your Personal Tour Guide
Ask me questions while you tour the home.