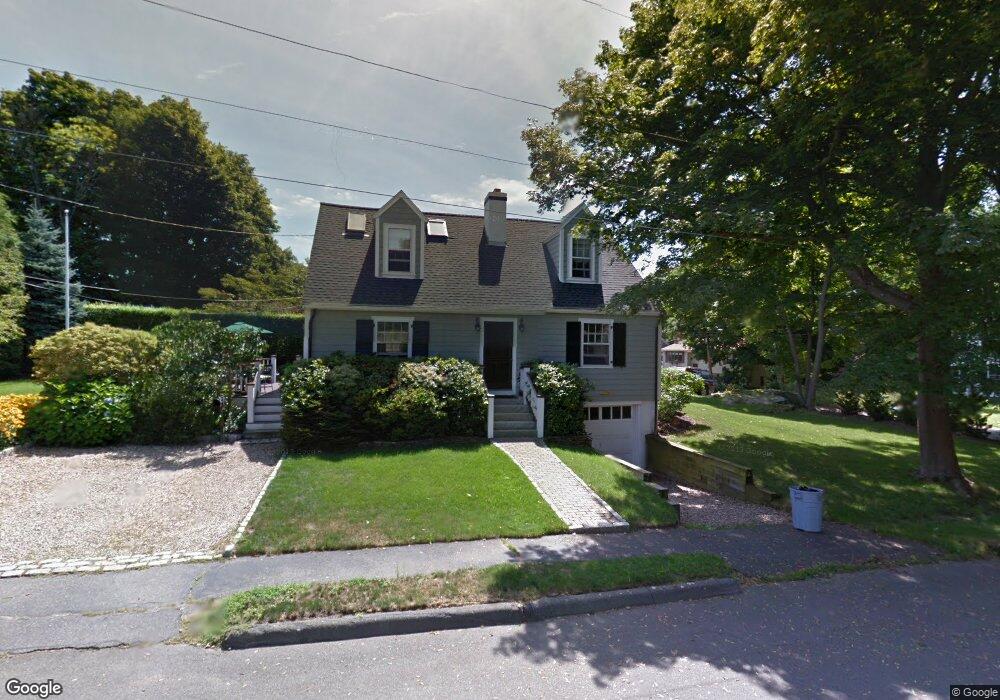
2 Campbell Way Marblehead, MA 01945
Estimated Value: $895,140 - $1,300,000
3
Beds
3
Baths
2,349
Sq Ft
$437/Sq Ft
Est. Value
About This Home
This home is located at 2 Campbell Way, Marblehead, MA 01945 and is currently estimated at $1,027,035, approximately $437 per square foot. 2 Campbell Way is a home located in Essex County with nearby schools including Marblehead High School, Marblehead Community Charter Public School, and Tower School.
Ownership History
Date
Name
Owned For
Owner Type
Purchase Details
Closed on
Dec 5, 2022
Sold by
Carlin Louise M
Bought by
2 Campbell Way Ret and Mcgowan
Current Estimated Value
Purchase Details
Closed on
Jun 12, 1997
Sold by
Flynn James D and Flynn Catherine T
Bought by
Carlin Robert B and Carlin Louise T
Purchase Details
Closed on
Jan 10, 1989
Sold by
Macomber Wm W
Bought by
Flynn James D
Create a Home Valuation Report for This Property
The Home Valuation Report is an in-depth analysis detailing your home's value as well as a comparison with similar homes in the area
Home Values in the Area
Average Home Value in this Area
Purchase History
| Date | Buyer | Sale Price | Title Company |
|---|---|---|---|
| 2 Campbell Way Ret | -- | None Available | |
| 2 Campbell Way Ret | -- | None Available | |
| 2 Campbell Way Ret | -- | None Available | |
| Carlin Robert B | $285,000 | -- | |
| Carlin Robert B | $285,000 | -- | |
| Flynn James D | $269,000 | -- | |
| Flynn James D | $269,000 | -- |
Source: Public Records
Mortgage History
| Date | Status | Borrower | Loan Amount |
|---|---|---|---|
| Previous Owner | Flynn James D | $161,000 | |
| Previous Owner | Flynn James D | $167,000 |
Source: Public Records
Tax History Compared to Growth
Tax History
| Year | Tax Paid | Tax Assessment Tax Assessment Total Assessment is a certain percentage of the fair market value that is determined by local assessors to be the total taxable value of land and additions on the property. | Land | Improvement |
|---|---|---|---|---|
| 2025 | $7,111 | $785,800 | $492,000 | $293,800 |
| 2024 | $6,449 | $719,700 | $528,900 | $190,800 |
| 2023 | $6,710 | $671,000 | $461,300 | $209,700 |
| 2022 | $6,456 | $613,700 | $405,900 | $207,800 |
| 2021 | $6,267 | $601,400 | $393,600 | $207,800 |
| 2020 | $5,810 | $559,200 | $381,300 | $177,900 |
| 2019 | $5,721 | $532,700 | $356,700 | $176,000 |
| 2018 | $5,735 | $520,400 | $344,400 | $176,000 |
| 2017 | $5,323 | $483,500 | $307,500 | $176,000 |
| 2016 | $5,094 | $458,900 | $282,900 | $176,000 |
| 2015 | $4,797 | $432,900 | $270,600 | $162,300 |
| 2014 | $4,352 | $392,400 | $233,700 | $158,700 |
Source: Public Records
Map
Nearby Homes
- 89 Naugus Ave
- 2 Beacon Hill Rd
- 105 Green St Unit 4
- 51 Lincoln Ave
- 170 Jersey St
- 31 Lincoln Park
- 10 Shepard St
- 87 Jersey St
- 4 Broadmere Way
- 45 Peach Highlands
- 33 Intrepid Cir Unit 208
- 24-26 Knight Ave
- 37 Peach Highlands
- 215 W Shore Dr
- 66 Jersey St
- 25 Curtis St
- 197A W Shore Dr Unit A
- 155 Village St
- 3 Frost Ln Unit 1
- 132 Elm St