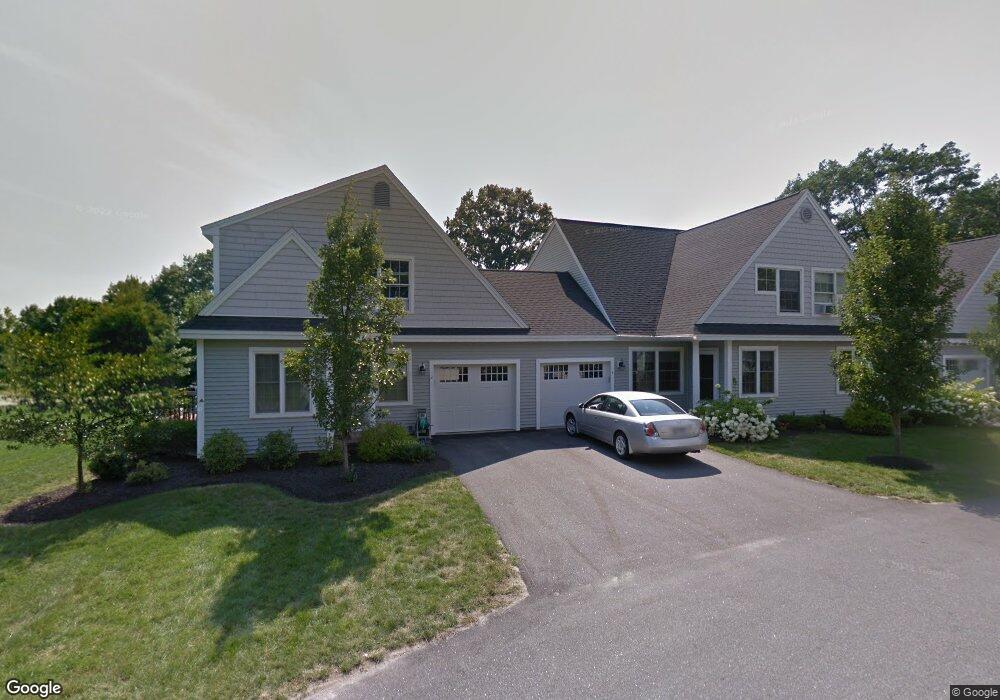
2 Carriage Way Saco, ME 04072
Central Saco NeighborhoodEstimated Value: $472,003 - $503,000
3
Beds
2
Baths
1,446
Sq Ft
$340/Sq Ft
Est. Value
About This Home
This home is located at 2 Carriage Way, Saco, ME 04072 and is currently estimated at $492,001, approximately $340 per square foot. 2 Carriage Way is a home located in York County with nearby schools including C K Burns School, Saco Middle School, and Saint James School.
Ownership History
Date
Name
Owned For
Owner Type
Purchase Details
Closed on
Aug 6, 2015
Sold by
Lennon Peter D and Desjardins Susan Y
Bought by
Desjardins Lennon Lt
Current Estimated Value
Purchase Details
Closed on
Jun 10, 2014
Sold by
Bellerose Russell J
Bought by
Lennon Peter D and Desjardins Susan Y
Home Financials for this Owner
Home Financials are based on the most recent Mortgage that was taken out on this home.
Original Mortgage
$180,000
Outstanding Balance
$135,874
Interest Rate
4%
Mortgage Type
Adjustable Rate Mortgage/ARM
Estimated Equity
$356,127
Purchase Details
Closed on
Sep 28, 2010
Sold by
Emery Bruce M
Bought by
Bellerose Russell J
Purchase Details
Closed on
May 16, 2006
Sold by
Capital 5 Llc
Bought by
Bellerose Kathy A and Bellerose Russell J
Home Financials for this Owner
Home Financials are based on the most recent Mortgage that was taken out on this home.
Original Mortgage
$188,000
Interest Rate
6.4%
Mortgage Type
Unknown
Create a Home Valuation Report for This Property
The Home Valuation Report is an in-depth analysis detailing your home's value as well as a comparison with similar homes in the area
Home Values in the Area
Average Home Value in this Area
Purchase History
| Date | Buyer | Sale Price | Title Company |
|---|---|---|---|
| Desjardins Lennon Lt | -- | -- | |
| Lennon Peter D | -- | -- | |
| Bellerose Russell J | -- | -- | |
| Bellerose Russell J | -- | -- | |
| Bellerose Kathy A | -- | -- |
Source: Public Records
Mortgage History
| Date | Status | Borrower | Loan Amount |
|---|---|---|---|
| Open | Lennon Peter D | $180,000 | |
| Previous Owner | Bellerose Russell J | $179,200 | |
| Previous Owner | Bellerose Kathy A | $188,000 |
Source: Public Records
Tax History Compared to Growth
Tax History
| Year | Tax Paid | Tax Assessment Tax Assessment Total Assessment is a certain percentage of the fair market value that is determined by local assessors to be the total taxable value of land and additions on the property. | Land | Improvement |
|---|---|---|---|---|
| 2024 | $5,009 | $356,500 | $108,900 | $247,600 |
| 2023 | $5,258 | $356,500 | $108,900 | $247,600 |
| 2022 | $4,685 | $255,600 | $83,000 | $172,600 |
| 2021 | $4,486 | $237,600 | $76,300 | $161,300 |
| 2020 | $4,278 | $217,500 | $73,100 | $144,400 |
| 2019 | $4,215 | $217,500 | $73,100 | $144,400 |
| 2018 | $3,991 | $210,800 | $66,400 | $144,400 |
| 2017 | $4,285 | $221,100 | $66,400 | $154,700 |
| 2016 | $3,991 | $205,500 | $55,500 | $150,000 |
| 2015 | $3,950 | $205,500 | $55,500 | $150,000 |
| 2014 | $3,826 | $205,500 | $55,500 | $150,000 |
| 2013 | $3,818 | $205,500 | $55,500 | $150,000 |
Source: Public Records
Map
Nearby Homes
- 5 Academy Place Unit 57
- 15 Lucille St
- 11 Louise St
- 36 Lafayette St
- 15 Lafayette St
- 22 Ocean Park Rd Unit 133
- 22 Ocean Park Rd Unit 136
- 162 Beach St Unit 10
- 61 Ocean Park Rd Unit 11
- 50 Ocean Park Rd Unit 12
- 372 Main St Unit 201
- 4 Westward Ln
- 16 Heritage Way Unit 17
- 18 Heritage Way Unit 14
- 8 Heritage Way Unit 15
- 22 James St
- 9 Cross St
- 642 Main St
- 00 Sawyer St
- 24 Roebuck Ave
- 15 Carriage Way
- 15 Carriage Way Unit 9
- 9 Carriage Way
- 9 Carriage Way Unit 12
- 9 Carriage Way Unit 4
- 4 Carriage Way
- 4 Carriage Way Unit S2
- 11 Carriage Way
- 13 Carriage Way
- 22 Smith Ln
- 8 Carriage Way
- 14 Smith Ln
- 5 Academy Place Unit 64
- 5 Academy Place Unit 63
- 5 Academy Place Unit 62
- 5 Academy Place Unit 61
- 5 Academy Place Unit 60
- 5 Academy Place Unit 58
- 24 Smith Ln
- 3 Horseshoe Dr