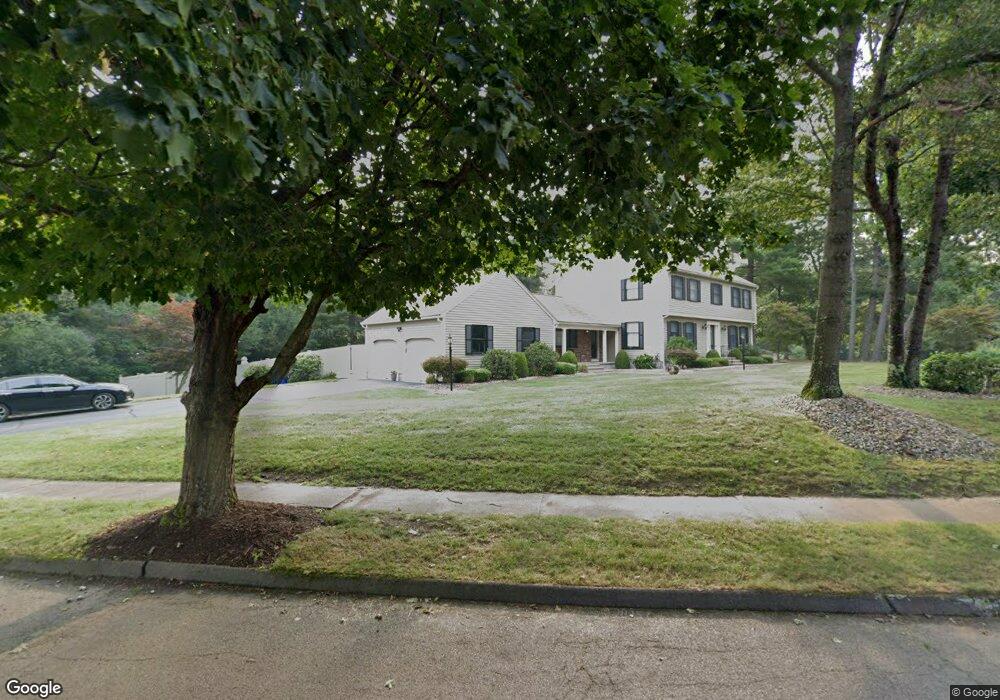
2 Catherine Cir Wilbraham, MA 01095
Estimated Value: $606,000 - $688,000
4
Beds
3
Baths
2,709
Sq Ft
$233/Sq Ft
Est. Value
About This Home
This home is located at 2 Catherine Cir, Wilbraham, MA 01095 and is currently estimated at $631,947, approximately $233 per square foot. 2 Catherine Cir is a home located in Hampden County with nearby schools including Minnechaug Regional High School and Wilbraham & Monson Academy.
Ownership History
Date
Name
Owned For
Owner Type
Purchase Details
Closed on
Jan 15, 2010
Sold by
Wright Timothy C and Wright Gail L
Bought by
Semanie Michael G and Semanie Nicole M
Current Estimated Value
Home Financials for this Owner
Home Financials are based on the most recent Mortgage that was taken out on this home.
Original Mortgage
$323,463
Outstanding Balance
$215,582
Interest Rate
5.25%
Mortgage Type
FHA
Estimated Equity
$416,365
Create a Home Valuation Report for This Property
The Home Valuation Report is an in-depth analysis detailing your home's value as well as a comparison with similar homes in the area
Home Values in the Area
Average Home Value in this Area
Purchase History
| Date | Buyer | Sale Price | Title Company |
|---|---|---|---|
| Semanie Michael G | $340,000 | -- |
Source: Public Records
Mortgage History
| Date | Status | Borrower | Loan Amount |
|---|---|---|---|
| Open | Semanie Michael G | $323,463 |
Source: Public Records
Tax History Compared to Growth
Tax History
| Year | Tax Paid | Tax Assessment Tax Assessment Total Assessment is a certain percentage of the fair market value that is determined by local assessors to be the total taxable value of land and additions on the property. | Land | Improvement |
|---|---|---|---|---|
| 2025 | $9,847 | $550,700 | $119,000 | $431,700 |
| 2024 | $9,707 | $524,700 | $119,000 | $405,700 |
| 2023 | $8,729 | $471,100 | $119,000 | $352,100 |
| 2022 | $8,729 | $426,000 | $119,000 | $307,000 |
| 2021 | $8,541 | $372,000 | $125,000 | $247,000 |
| 2020 | $8,325 | $372,000 | $125,000 | $247,000 |
| 2019 | $8,114 | $372,200 | $125,000 | $247,200 |
| 2018 | $8,105 | $358,000 | $125,000 | $233,000 |
| 2017 | $7,876 | $358,000 | $125,000 | $233,000 |
| 2016 | $8,072 | $373,700 | $138,700 | $235,000 |
| 2015 | $7,803 | $373,700 | $138,700 | $235,000 |
Source: Public Records
Map
Nearby Homes