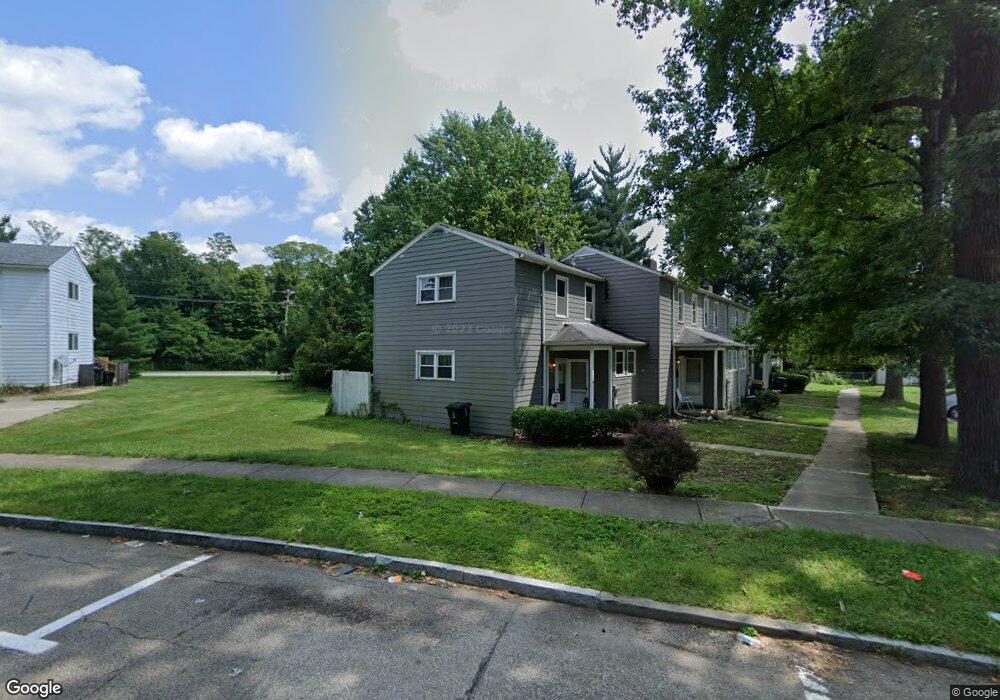
2 Chalmers Ct Cincinnati, OH 45218
Estimated Value: $128,000 - $140,000
2
Beds
1
Bath
840
Sq Ft
$159/Sq Ft
Est. Value
About This Home
This home is located at 2 Chalmers Ct, Cincinnati, OH 45218 and is currently estimated at $133,333, approximately $158 per square foot. 2 Chalmers Ct is a home located in Hamilton County with nearby schools including Central Montessori Academy and John Paul II Catholic School.
Ownership History
Date
Name
Owned For
Owner Type
Purchase Details
Closed on
Feb 5, 2019
Sold by
17 Chalmers Llc
Bought by
Impar Llc
Current Estimated Value
Home Financials for this Owner
Home Financials are based on the most recent Mortgage that was taken out on this home.
Original Mortgage
$390,000
Outstanding Balance
$342,880
Interest Rate
4.5%
Mortgage Type
Unknown
Estimated Equity
-$209,547
Purchase Details
Closed on
Dec 21, 2017
Sold by
Chalmers Townhomes Llc
Bought by
17 Chalmers Llc
Purchase Details
Closed on
Dec 14, 2011
Sold by
Humphreys Robert Andrew and Humphreys Ruth Ellen
Bought by
Sizemore Lance R
Home Financials for this Owner
Home Financials are based on the most recent Mortgage that was taken out on this home.
Original Mortgage
$255,000
Interest Rate
4.01%
Mortgage Type
Seller Take Back
Create a Home Valuation Report for This Property
The Home Valuation Report is an in-depth analysis detailing your home's value as well as a comparison with similar homes in the area
Home Values in the Area
Average Home Value in this Area
Purchase History
| Date | Buyer | Sale Price | Title Company |
|---|---|---|---|
| Impar Llc | $525,000 | None Available | |
| 17 Chalmers Llc | -- | None Available | |
| Sizemore Lance R | $300,000 | Attorney |
Source: Public Records
Mortgage History
| Date | Status | Borrower | Loan Amount |
|---|---|---|---|
| Open | Impar Llc | $390,000 | |
| Previous Owner | Sizemore Lance R | $255,000 |
Source: Public Records
Tax History Compared to Growth
Tax History
| Year | Tax Paid | Tax Assessment Tax Assessment Total Assessment is a certain percentage of the fair market value that is determined by local assessors to be the total taxable value of land and additions on the property. | Land | Improvement |
|---|---|---|---|---|
| 2024 | $1,931 | $27,524 | $10,255 | $17,269 |
| 2023 | $1,926 | $27,524 | $10,255 | $17,269 |
| 2022 | $1,310 | $15,163 | $4,281 | $10,882 |
| 2021 | $1,310 | $15,163 | $4,281 | $10,882 |
| 2020 | $1,296 | $15,163 | $4,281 | $10,882 |
| 2019 | $1,266 | $12,958 | $3,658 | $9,300 |
| 2018 | $1,268 | $12,958 | $3,658 | $9,300 |
| 2017 | $1,193 | $12,958 | $3,658 | $9,300 |
| 2016 | $1,010 | $10,567 | $4,200 | $6,367 |
| 2015 | $939 | $10,567 | $4,200 | $6,367 |
| 2014 | $959 | $10,567 | $4,200 | $6,367 |
| 2013 | $932 | $10,567 | $4,200 | $6,367 |
Source: Public Records
Map
Nearby Homes
- 3 Chalmers Ct
- 1 Chalmers Ct
- 0 Chalmers Ct
- 4 Chalmers Ct
- 5 Chalmers Ct
- 20 Chalmers Ln
- 6 Chalmers Ct
- 6 Chalmers Ct
- 18 Chalmers Ln
- 14 Chalmers Ln
- 17 Chalmers Ct
- 21 Chalmers Ct
- 17 Chalmers Ct Unit 1-6
- 7 Chalmers Ct
- 17 Chalmers Ln Unit 1-6
- 17 Chalmers Ln
- 19 Chalmers Ct
- 8 Chalmers Ct
- 17 Chalmers Ln
- 10 Chalmers Ct