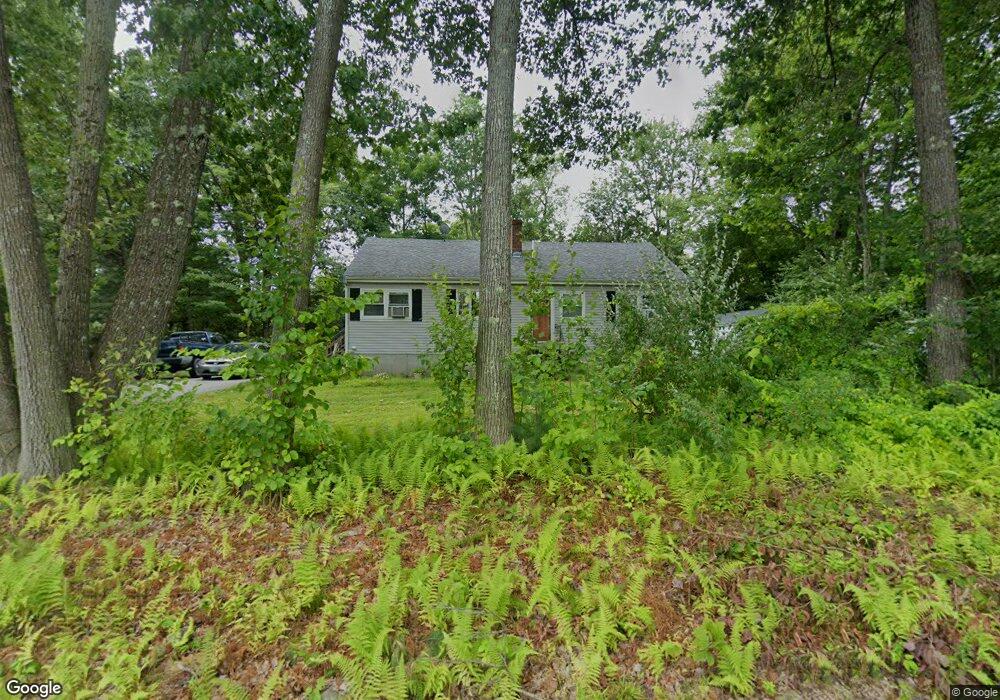
2 Chase Rd Newton, NH 03858
Estimated Value: $493,847 - $567,000
3
Beds
2
Baths
1,232
Sq Ft
$435/Sq Ft
Est. Value
About This Home
This home is located at 2 Chase Rd, Newton, NH 03858 and is currently estimated at $535,962, approximately $435 per square foot. 2 Chase Rd is a home located in Rockingham County with nearby schools including Memorial School, Sanborn Regional Middle School, and Sanborn Regional High School.
Ownership History
Date
Name
Owned For
Owner Type
Purchase Details
Closed on
Jun 2, 2004
Sold by
Donegan Kevin and Donegan Kari-Lin S
Bought by
Kay Lisa and Kay Richard
Current Estimated Value
Home Financials for this Owner
Home Financials are based on the most recent Mortgage that was taken out on this home.
Original Mortgage
$248,825
Outstanding Balance
$121,145
Interest Rate
5.94%
Mortgage Type
Purchase Money Mortgage
Estimated Equity
$414,817
Purchase Details
Closed on
Aug 14, 2000
Sold by
Ward Michael C and Ward Donna J
Bought by
Donegan Kevin M and Donegan Kari-Lin S
Home Financials for this Owner
Home Financials are based on the most recent Mortgage that was taken out on this home.
Original Mortgage
$128,800
Interest Rate
8.21%
Create a Home Valuation Report for This Property
The Home Valuation Report is an in-depth analysis detailing your home's value as well as a comparison with similar homes in the area
Home Values in the Area
Average Home Value in this Area
Purchase History
| Date | Buyer | Sale Price | Title Company |
|---|---|---|---|
| Kay Lisa | $251,200 | -- | |
| Donegan Kevin M | $161,000 | -- |
Source: Public Records
Mortgage History
| Date | Status | Borrower | Loan Amount |
|---|---|---|---|
| Open | Donegan Kevin M | $248,825 | |
| Previous Owner | Donegan Kevin M | $128,800 |
Source: Public Records
Tax History
| Year | Tax Paid | Tax Assessment Tax Assessment Total Assessment is a certain percentage of the fair market value that is determined by local assessors to be the total taxable value of land and additions on the property. | Land | Improvement |
|---|---|---|---|---|
| 2024 | $7,071 | $278,700 | $129,700 | $149,000 |
| 2023 | $6,859 | $278,700 | $129,700 | $149,000 |
| 2022 | $6,268 | $278,700 | $129,700 | $149,000 |
| 2021 | $5,825 | $278,700 | $129,700 | $149,000 |
| 2020 | $6,122 | $278,700 | $129,700 | $149,000 |
| 2019 | $5,582 | $211,600 | $91,200 | $120,400 |
| 2018 | $5,652 | $211,600 | $91,200 | $120,400 |
| 2017 | $5,624 | $211,600 | $91,200 | $120,400 |
| 2016 | $5,585 | $211,600 | $91,200 | $120,400 |
| 2015 | $5,538 | $211,600 | $91,200 | $120,400 |
| 2014 | $5,486 | $211,500 | $91,200 | $120,300 |
| 2013 | $5,351 | $211,500 | $91,200 | $120,300 |
Source: Public Records
Map
Nearby Homes
- 52 Whittier St
- 8 Chongor Dr
- 19 Maple Ave
- 4 Nordic Wood Ln
- 5 Ridge Rd
- 3 Brenner Dr
- 62 & 43 Wilders Grove Rd
- 15 Bootland Farm Rd
- 21 Currier St
- 12 W Shore Park Rd
- 34-A Smith Corner Rd
- 3 Bent Grass Cir Unit 34
- 142 Haverhill Rd
- 152 Kimball Rd
- 40 Coopers Grove Rd
- 11 Dulcies Point Rd
- 8 Dulcies Point Rd
- 13 Dulcies Point Rd
- 25 Mill Rd
- 61 Church St
Your Personal Tour Guide
Ask me questions while you tour the home.