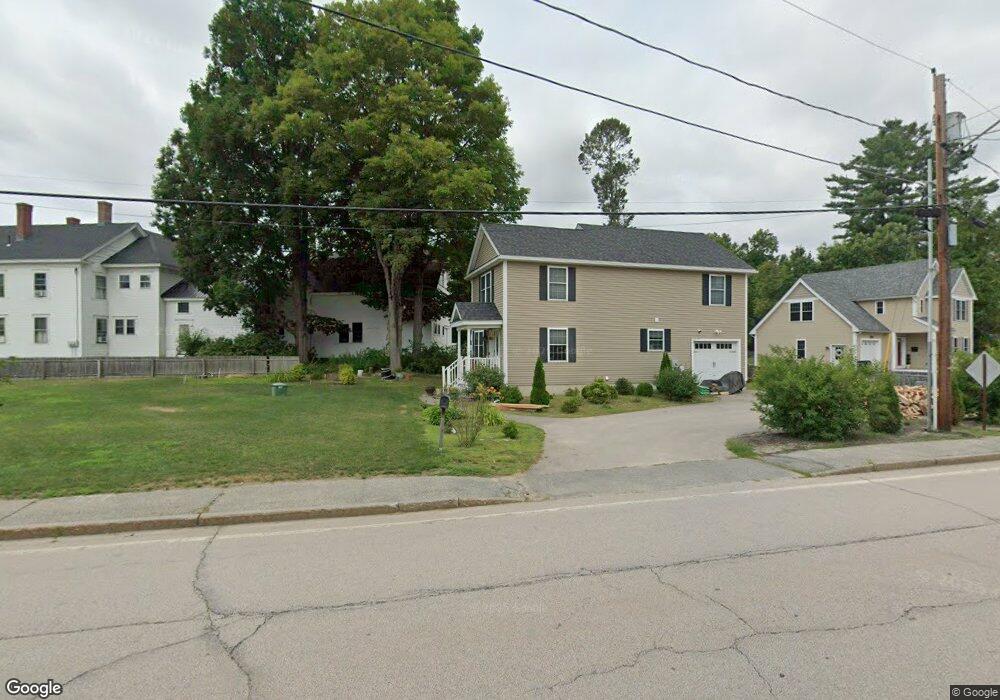
2 Chase St Hudson, NH 03051
Estimated Value: $550,000 - $577,052
3
Beds
2
Baths
1,737
Sq Ft
$325/Sq Ft
Est. Value
About This Home
This home is located at 2 Chase St, Hudson, NH 03051 and is currently estimated at $564,763, approximately $325 per square foot. 2 Chase St is a home located in Hillsborough County with nearby schools including Nottingham West Elementary School, Hudson Memorial School, and Alvirne High School.
Ownership History
Date
Name
Owned For
Owner Type
Purchase Details
Closed on
Apr 6, 2017
Sold by
Wynott Grove Llc
Bought by
Lyons David and Curley Samia
Current Estimated Value
Home Financials for this Owner
Home Financials are based on the most recent Mortgage that was taken out on this home.
Original Mortgage
$256,410
Outstanding Balance
$126,429
Interest Rate
4.16%
Mortgage Type
Purchase Money Mortgage
Estimated Equity
$438,334
Purchase Details
Closed on
Oct 14, 2014
Sold by
Rpnt Props
Bought by
Wynott Grove Llc
Create a Home Valuation Report for This Property
The Home Valuation Report is an in-depth analysis detailing your home's value as well as a comparison with similar homes in the area
Home Values in the Area
Average Home Value in this Area
Purchase History
| Date | Buyer | Sale Price | Title Company |
|---|---|---|---|
| Lyons David | $285,000 | -- | |
| Wynott Grove Llc | $51,000 | -- |
Source: Public Records
Mortgage History
| Date | Status | Borrower | Loan Amount |
|---|---|---|---|
| Open | Lyons David | $256,410 |
Source: Public Records
Tax History
| Year | Tax Paid | Tax Assessment Tax Assessment Total Assessment is a certain percentage of the fair market value that is determined by local assessors to be the total taxable value of land and additions on the property. | Land | Improvement |
|---|---|---|---|---|
| 2025 | $7,327 | $428,200 | $119,800 | $308,400 |
| 2024 | $7,044 | $428,200 | $119,800 | $308,400 |
| 2023 | $6,714 | $428,200 | $119,800 | $308,400 |
| 2022 | $6,290 | $428,200 | $119,800 | $308,400 |
| 2021 | $6,258 | $288,800 | $74,200 | $214,600 |
| 2020 | $6,172 | $288,800 | $74,200 | $214,600 |
| 2019 | $5,857 | $288,800 | $74,200 | $214,600 |
| 2018 | $5,805 | $288,800 | $74,200 | $214,600 |
| 2017 | $5,695 | $288,800 | $74,200 | $214,600 |
| 2016 | $3,994 | $181,800 | $66,400 | $115,400 |
| 2015 | $1,269 | $59,700 | $59,700 | $0 |
| 2014 | $1,244 | $59,700 | $59,700 | $0 |
| 2013 | $1,227 | $59,700 | $59,700 | $0 |
Source: Public Records
Map
Nearby Homes
Your Personal Tour Guide
Ask me questions while you tour the home.