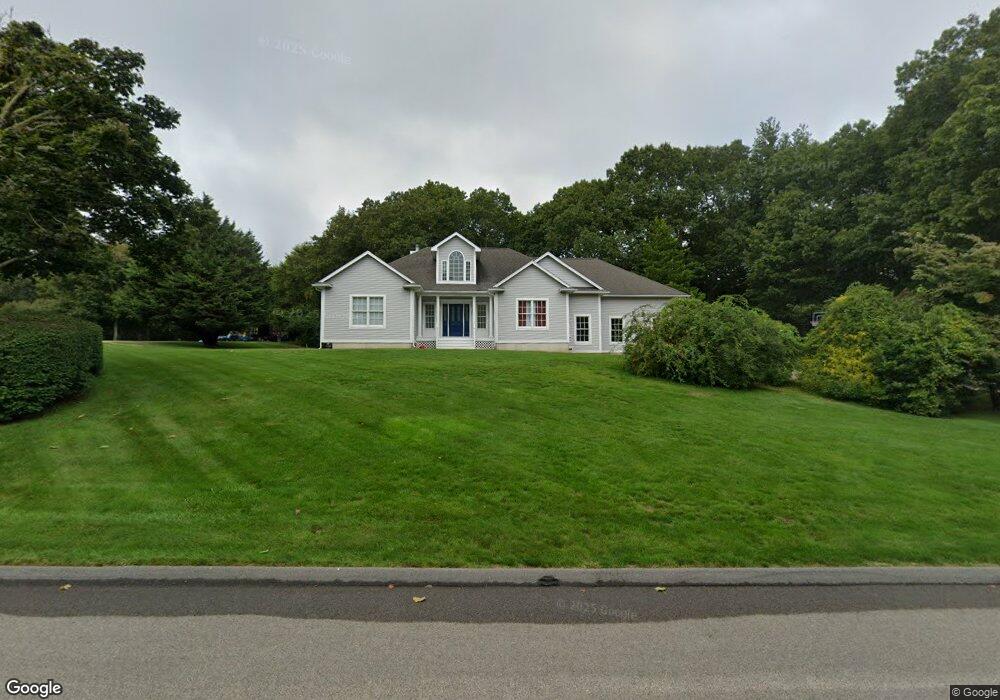
2 Chatham Ct Westerly, RI 02891
Estimated Value: $1,208,503 - $1,368,000
3
Beds
3
Baths
3,024
Sq Ft
$429/Sq Ft
Est. Value
About This Home
This home is located at 2 Chatham Ct, Westerly, RI 02891 and is currently estimated at $1,297,876, approximately $429 per square foot. 2 Chatham Ct is a home located in Washington County with nearby schools including Westerly High School and St. Michael School.
Ownership History
Date
Name
Owned For
Owner Type
Purchase Details
Closed on
Oct 4, 2006
Sold by
Corr John J and Corr Lorraine C
Bought by
Dobson Gary A
Current Estimated Value
Home Financials for this Owner
Home Financials are based on the most recent Mortgage that was taken out on this home.
Original Mortgage
$475,000
Outstanding Balance
$283,230
Interest Rate
6.54%
Mortgage Type
Purchase Money Mortgage
Estimated Equity
$1,014,646
Purchase Details
Closed on
Jun 30, 1999
Sold by
Rycal Llc
Bought by
Corr John J and Corr Lorraine C
Home Financials for this Owner
Home Financials are based on the most recent Mortgage that was taken out on this home.
Original Mortgage
$272,000
Interest Rate
7.19%
Mortgage Type
Purchase Money Mortgage
Create a Home Valuation Report for This Property
The Home Valuation Report is an in-depth analysis detailing your home's value as well as a comparison with similar homes in the area
Home Values in the Area
Average Home Value in this Area
Purchase History
| Date | Buyer | Sale Price | Title Company |
|---|---|---|---|
| Dobson Gary A | $675,000 | -- | |
| Corr John J | $343,250 | -- | |
| Rycal Llc | $84,500 | -- |
Source: Public Records
Mortgage History
| Date | Status | Borrower | Loan Amount |
|---|---|---|---|
| Open | Rycal Llc | $475,000 | |
| Previous Owner | Rycal Llc | $236,000 | |
| Previous Owner | Rycal Llc | $272,000 |
Source: Public Records
Tax History
| Year | Tax Paid | Tax Assessment Tax Assessment Total Assessment is a certain percentage of the fair market value that is determined by local assessors to be the total taxable value of land and additions on the property. | Land | Improvement |
|---|---|---|---|---|
| 2025 | $8,696 | $1,117,800 | $477,400 | $640,400 |
| 2024 | $9,375 | $897,100 | $343,300 | $553,800 |
| 2023 | $8,641 | $850,500 | $343,300 | $507,200 |
| 2022 | $8,590 | $850,500 | $343,300 | $507,200 |
| 2021 | $8,010 | $664,200 | $249,500 | $414,700 |
| 2020 | $7,871 | $664,200 | $249,500 | $414,700 |
| 2019 | $7,798 | $664,200 | $249,500 | $414,700 |
| 2018 | $7,235 | $585,800 | $249,500 | $336,300 |
| 2017 | $7,030 | $585,800 | $249,500 | $336,300 |
| 2016 | $7,030 | $585,800 | $249,500 | $336,300 |
| 2015 | $6,975 | $621,100 | $267,000 | $354,100 |
| 2014 | $6,863 | $621,100 | $267,000 | $354,100 |
Source: Public Records
Map
Nearby Homes
- 9 Compass Way Unit 201
- 9 Compass Way Unit 202
- 9 Compass Way Unit 101
- 9 Compass Way Unit 102
- 9 Compass Way Unit 103
- 9 Compass Way Unit 203
- 10 Tristam St
- 27 Benson Ave
- 19 Wicklow Rd
- 18 Timothy Dr
- 4 Shore Rd
- 109 Watch Hill Rd
- 54 Sherwood Dr
- 4 Quail Run
- 417 River Rd
- 432 Atlantic Ave
- 446 Atlantic Ave
- 52 Avondale Rd
- 60 Avondale Rd
- 470 Atlantic Ave
Your Personal Tour Guide
Ask me questions while you tour the home.