
Seller's Agent in 2023
Yolanda Mendez
RE/MAX
(973) 760-4994
1 in this area
34 Total Sales
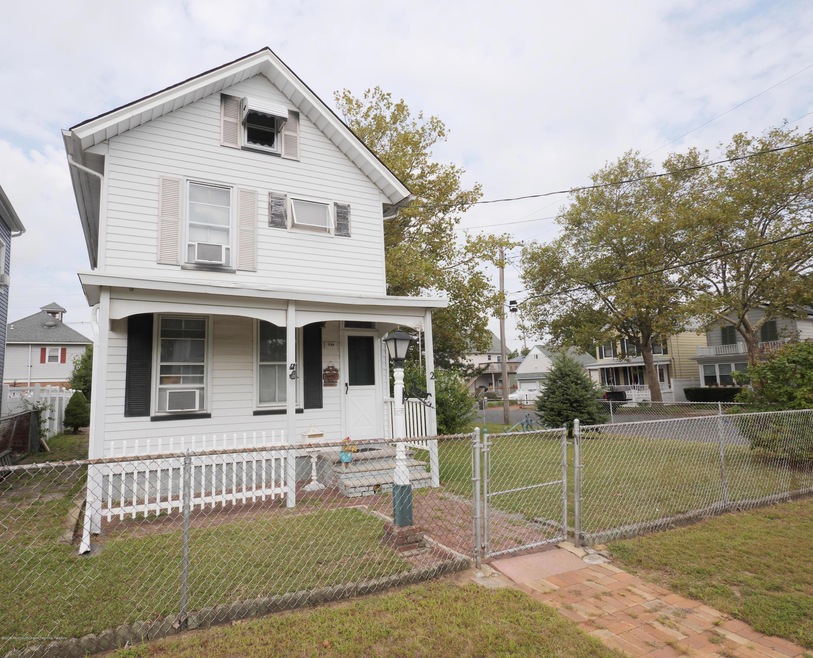
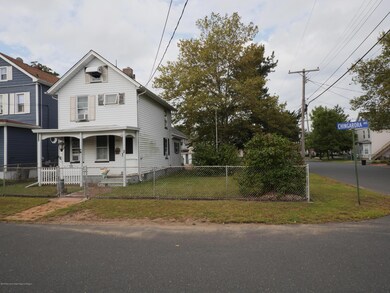
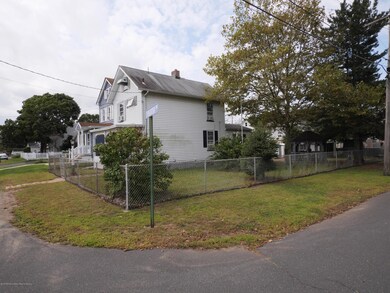
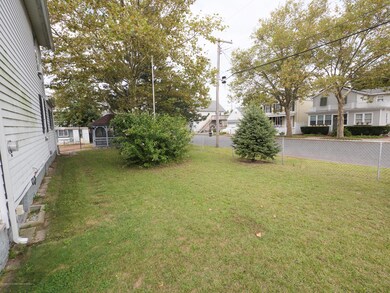
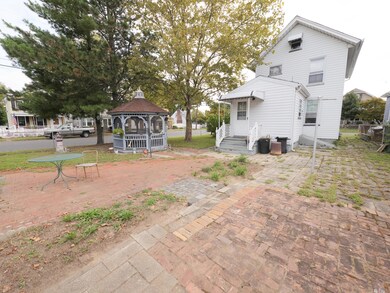
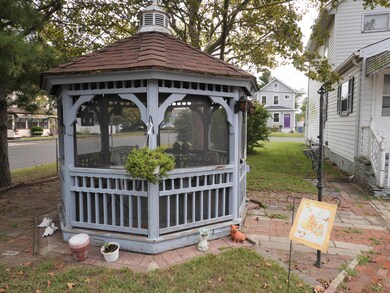

Seller is ready to move on..Two story home with lots of potential..Historical Keyport has lots of charm. Corner property and close to downtown Keyport. Not a lot of towns have what we have. Sit by the waterfront and enjoy the beautiful sunset. Restaurants..salons and shops near by..
Last Agent to Sell the Property
Susan LoSapio
VRI Homes Brokerage Phone: 800-531-2885 Listed on: 09/11/2019
Home Type
Est. Annual Taxes
Lot Details
Home Design
Interior Spaces
Kitchen
Flooring
Bedrooms and Bathrooms
Laundry
Parking
Outdoor Features
Schools
Utilities
Community Details
Listing and Financial Details
| Date | Type | Sale Price | Title Company |
|---|---|---|---|
| Deed | $175,000 | None Available |
| Date | Event | Price | Change | Sq Ft Price |
|---|---|---|---|---|
| 06/12/2023 06/12/23 | Sold | $335,000 | +1.5% | $352 / Sq Ft |
| 05/30/2023 05/30/23 | For Sale | $329,900 | 0.0% | $347 / Sq Ft |
| 04/05/2023 04/05/23 | Pending | -- | -- | -- |
| 03/22/2023 03/22/23 | For Sale | $329,900 | 0.0% | $347 / Sq Ft |
| 02/25/2020 02/25/20 | Rented | $1,800 | 0.0% | -- |
| 02/17/2020 02/17/20 | For Rent | $1,800 | 0.0% | -- |
| 11/01/2019 11/01/19 | Sold | $175,000 | -- | $184 / Sq Ft |
| Year | Tax Paid | Tax Assessment Tax Assessment Total Assessment is a certain percentage of the fair market value that is determined by local assessors to be the total taxable value of land and additions on the property. | Land | Improvement |
|---|---|---|---|---|
| 2024 | $6,212 | $340,300 | $192,300 | $148,000 |
| 2023 | $6,212 | $282,600 | $174,800 | $107,800 |
| 2022 | $5,047 | $245,700 | $152,000 | $93,700 |
| 2021 | $5,047 | $216,700 | $140,800 | $75,900 |
| 2020 | $5,350 | $210,400 | $135,300 | $75,100 |
| 2019 | $5,822 | $229,300 | $130,000 | $99,300 |
| 2018 | $5,795 | $222,900 | $130,000 | $92,900 |
| 2017 | $5,652 | $216,800 | $125,000 | $91,800 |
| 2016 | $5,483 | $212,100 | $125,000 | $87,100 |
| 2015 | $5,090 | $196,000 | $110,000 | $86,000 |
| 2014 | $4,547 | $176,800 | $85,000 | $91,800 |
Seller's Agent in 2023
Yolanda Mendez
RE/MAX
(973) 760-4994
1 in this area
34 Total Sales
S
Buyer's Agent in 2023
Stephanie Orefice
Robert DeFalco Realty Inc.
(917) 855-9153
1 in this area
62 Total Sales
Seller's Agent in 2020
Kelle Burrough
RE/MAX
(732) 403-7137
21 Total Sales
C
Buyer's Agent in 2020
Christine Gisondi
BHHS Fox & Roach
C
Buyer's Agent in 2020
Christina Gisondi
Weichert Realtors-Old Bridge
(908) 433-5577
3 Total Sales
S
Seller's Agent in 2019
Susan LoSapio
VRI Homes
Source: MOREMLS (Monmouth Ocean Regional REALTORS®)
MLS Number: 21937394
APN: 24-00023-0000-00003
Disclaimer: Certain information contained herein is derived from information provided by parties other than Homes.com. All information provided is deemed reliable, but is not guaranteed to be accurate and should be independently verified.
![]() IDX information is provided exclusively for personal, non-commercial use, and may not be used for any purpose other than to identify prospective properties consumers may be interested in purchasing.
IDX information is provided exclusively for personal, non-commercial use, and may not be used for any purpose other than to identify prospective properties consumers may be interested in purchasing.
Information is deemed reliable but not guaranteed.