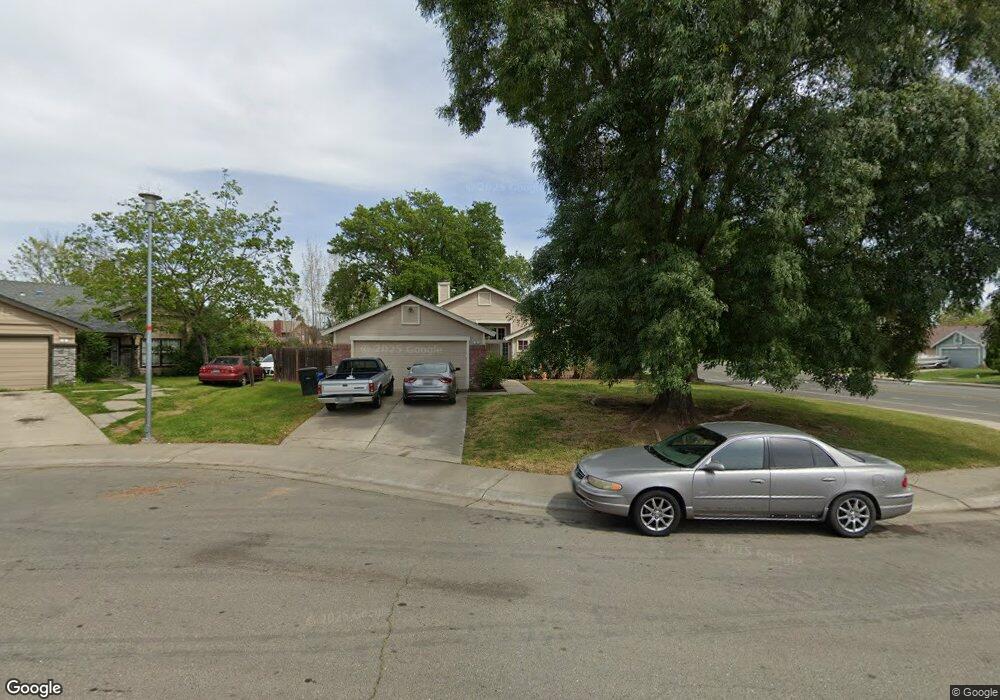
2 Cismont Ct Sacramento, CA 95823
North Laguna NeighborhoodEstimated Value: $432,000 - $480,648
3
Beds
3
Baths
1,377
Sq Ft
$339/Sq Ft
Est. Value
About This Home
This home is located at 2 Cismont Ct, Sacramento, CA 95823 and is currently estimated at $467,162, approximately $339 per square foot. 2 Cismont Ct is a home located in Sacramento County with nearby schools including John Reith Elementary School, Samuel Jackman Middle School, and Valley High School.
Ownership History
Date
Name
Owned For
Owner Type
Purchase Details
Closed on
Dec 30, 2015
Sold by
Lee Kuek Hock and Lo Shuk Tshin
Bought by
Lee Kuek Hock and Lo Shuk Tshin
Current Estimated Value
Home Financials for this Owner
Home Financials are based on the most recent Mortgage that was taken out on this home.
Original Mortgage
$152,500
Outstanding Balance
$64,699
Interest Rate
3.92%
Mortgage Type
New Conventional
Estimated Equity
$402,463
Purchase Details
Closed on
Nov 14, 2007
Sold by
Lee Kuek Hock and Lo Shuk Tshin
Bought by
Lee Kuek Hock and Lo Shuk Tshin
Home Financials for this Owner
Home Financials are based on the most recent Mortgage that was taken out on this home.
Original Mortgage
$168,500
Interest Rate
6.12%
Mortgage Type
New Conventional
Purchase Details
Closed on
Mar 21, 2007
Sold by
Lee Kuek Hock and Lo Shuk Tshin
Bought by
Lee Kuek Hock and Lo Shuk Tshin
Purchase Details
Closed on
Nov 3, 2006
Sold by
Owens Michael and Vaughn Owens Patrice
Bought by
Lee Kuek Hock and Lo Shuk Tshin
Home Financials for this Owner
Home Financials are based on the most recent Mortgage that was taken out on this home.
Original Mortgage
$192,500
Interest Rate
1.75%
Mortgage Type
Negative Amortization
Create a Home Valuation Report for This Property
The Home Valuation Report is an in-depth analysis detailing your home's value as well as a comparison with similar homes in the area
Home Values in the Area
Average Home Value in this Area
Purchase History
| Date | Buyer | Sale Price | Title Company |
|---|---|---|---|
| Lee Kuek Hock | -- | Chicago Title Company | |
| Lee Kuek Hock | -- | Alliance Title Company | |
| Lee Kuek Hock | -- | None Available | |
| Lee Kuek Hock | $275,000 | Placer Title Company |
Source: Public Records
Mortgage History
| Date | Status | Borrower | Loan Amount |
|---|---|---|---|
| Open | Lee Kuek Hock | $152,500 | |
| Closed | Lee Kuek Hock | $168,500 | |
| Closed | Lee Kuek Hock | $192,500 |
Source: Public Records
Tax History Compared to Growth
Tax History
| Year | Tax Paid | Tax Assessment Tax Assessment Total Assessment is a certain percentage of the fair market value that is determined by local assessors to be the total taxable value of land and additions on the property. | Land | Improvement |
|---|---|---|---|---|
| 2025 | $4,195 | $368,422 | $120,572 | $247,850 |
| 2024 | $4,195 | $361,199 | $118,208 | $242,991 |
| 2023 | $4,079 | $354,118 | $115,891 | $238,227 |
| 2022 | $4,021 | $347,175 | $113,619 | $233,556 |
| 2021 | $3,306 | $278,426 | $100,232 | $178,194 |
| 2020 | $2,945 | $246,395 | $88,701 | $157,694 |
| 2019 | $2,771 | $230,277 | $82,899 | $147,378 |
| 2018 | $2,650 | $221,421 | $79,711 | $141,710 |
| 2017 | $2,490 | $206,937 | $74,497 | $132,440 |
| 2016 | $2,262 | $191,609 | $68,979 | $122,630 |
| 2015 | $2,066 | $174,191 | $62,709 | $111,482 |
| 2014 | $1,973 | $164,331 | $59,159 | $105,172 |
Source: Public Records
Map
Nearby Homes
- 5876 Calvine Rd
- 5546 Rightwood Way
- 8507 Carlin Ave
- 8409 Sunblaze Way
- 5241 Bassett Way
- 5349 Kevinberg Dr
- 8636 Carlin Ave
- 8565 Sunnybrae Dr
- 5001 Hari Gopal Way
- 63 Hallowell Ct
- 57 Hallowell Ct
- 62 Hallowell Ct
- 56 Hallowell Ct
- 1312 Winterhart St
- 8501 Center Pkwy
- 6441 Ventris Walk
- 8647 Starburst Way
- Biltmore Plan at Ventris Place
- Carefree Plan at Ventris Place
- Astoria Plan at Ventris Place
- 5801 Calvine Rd
- 4 Cismont Ct
- 5811 Calvine Rd
- 6 Cismont Ct
- 1 Cismont Ct
- 5800 Rightwood Way
- 5740 Calvine Rd
- 3 Cismont Ct
- 5720 Calvine Rd
- 5 Cismont Ct
- 5800 Calvine Rd
- 5821 Calvine Rd
- 5810 Rightwood Way
- 5790 Rightwood Way
- 5780 Rightwood Way
- 5770 Rightwood Way
- 5810 Calvine Rd
- 5700 Calvine Rd
- 5820 Rightwood Way
- 5760 Rightwood Way