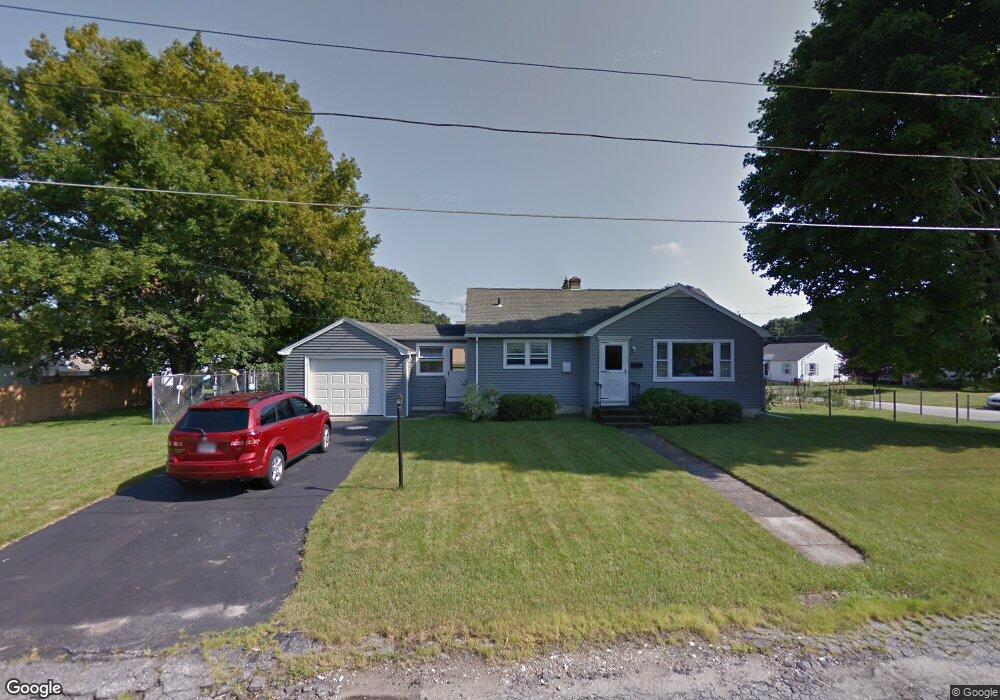
2 Clark St Auburn, MA 01501
Stoneville NeighborhoodEstimated Value: $371,220 - $467,000
2
Beds
2
Baths
930
Sq Ft
$450/Sq Ft
Est. Value
About This Home
This home is located at 2 Clark St, Auburn, MA 01501 and is currently estimated at $418,305, approximately $449 per square foot. 2 Clark St is a home located in Worcester County with nearby schools including Auburn Senior High School, Canterbury Street School, and Shrewsbury Montessori School - Auburn Campus.
Ownership History
Date
Name
Owned For
Owner Type
Purchase Details
Closed on
Dec 17, 2015
Sold by
Cappoli Lt and Cappoli Cesidio A
Bought by
Cappoli Albert M
Current Estimated Value
Purchase Details
Closed on
Apr 21, 2009
Sold by
Cappoli Cesidio A and Cappoli Matilda I
Bought by
Cappoli Tr Cesidio A and Cappoli Madilda I
Purchase Details
Closed on
Sep 23, 1996
Sold by
Wolkowicz John J and Wolkowicz Rita
Bought by
Plewa Jozef and Plewa Zofia
Home Financials for this Owner
Home Financials are based on the most recent Mortgage that was taken out on this home.
Original Mortgage
$87,500
Interest Rate
7.89%
Mortgage Type
Purchase Money Mortgage
Purchase Details
Closed on
Nov 13, 1989
Sold by
Joslyn Timothy
Bought by
Cappoli Albert
Home Financials for this Owner
Home Financials are based on the most recent Mortgage that was taken out on this home.
Original Mortgage
$76,000
Interest Rate
10.03%
Mortgage Type
Purchase Money Mortgage
Create a Home Valuation Report for This Property
The Home Valuation Report is an in-depth analysis detailing your home's value as well as a comparison with similar homes in the area
Home Values in the Area
Average Home Value in this Area
Purchase History
| Date | Buyer | Sale Price | Title Company |
|---|---|---|---|
| Cappoli Albert M | -- | -- | |
| Cappoli Tr Cesidio A | -- | -- | |
| Plewa Jozef | $125,000 | -- | |
| Cappoli Albert | $125,000 | -- |
Source: Public Records
Mortgage History
| Date | Status | Borrower | Loan Amount |
|---|---|---|---|
| Previous Owner | Cappoli Albert | $87,500 | |
| Previous Owner | Cappoli Albert | $76,000 |
Source: Public Records
Tax History
| Year | Tax Paid | Tax Assessment Tax Assessment Total Assessment is a certain percentage of the fair market value that is determined by local assessors to be the total taxable value of land and additions on the property. | Land | Improvement |
|---|---|---|---|---|
| 2025 | $49 | $346,100 | $113,300 | $232,800 |
| 2024 | $4,875 | $326,500 | $107,500 | $219,000 |
| 2023 | $4,688 | $295,200 | $97,700 | $197,500 |
| 2022 | $4,372 | $259,900 | $97,700 | $162,200 |
| 2021 | $4,120 | $227,100 | $86,200 | $140,900 |
| 2020 | $6,215 | $227,100 | $86,200 | $140,900 |
| 2019 | $3,916 | $212,600 | $85,300 | $127,300 |
| 2018 | $7,174 | $199,800 | $79,800 | $120,000 |
| 2017 | $3,527 | $192,300 | $72,300 | $120,000 |
| 2016 | $3,303 | $182,600 | $75,700 | $106,900 |
| 2015 | $3,088 | $178,900 | $75,700 | $103,200 |
| 2014 | $2,898 | $167,600 | $72,100 | $95,500 |
Source: Public Records
Map
Nearby Homes
- 5 Commonwealth Ave
- 177 Boyce St
- 99 Clover St
- 25 Vinal St Unit 28
- 25 Vinal St Unit 26
- 25 Vinal St Unit 29
- 25 Vinal St Unit 30
- 1 Rockland Road Ct
- 177 Oxford St N
- 11 Hulbert Rd Unit 13
- 19-20 Williams St
- 27 Havana Rd
- 40 Bryn Mawr Ave
- 31-33 Walsh Ave
- 33 Walsh Ave
- 31 Walsh Ave
- 6 Buron Terrace
- 204-212 Hampton St
- 103 Henshaw St
- 84 Eureka St
Your Personal Tour Guide
Ask me questions while you tour the home.