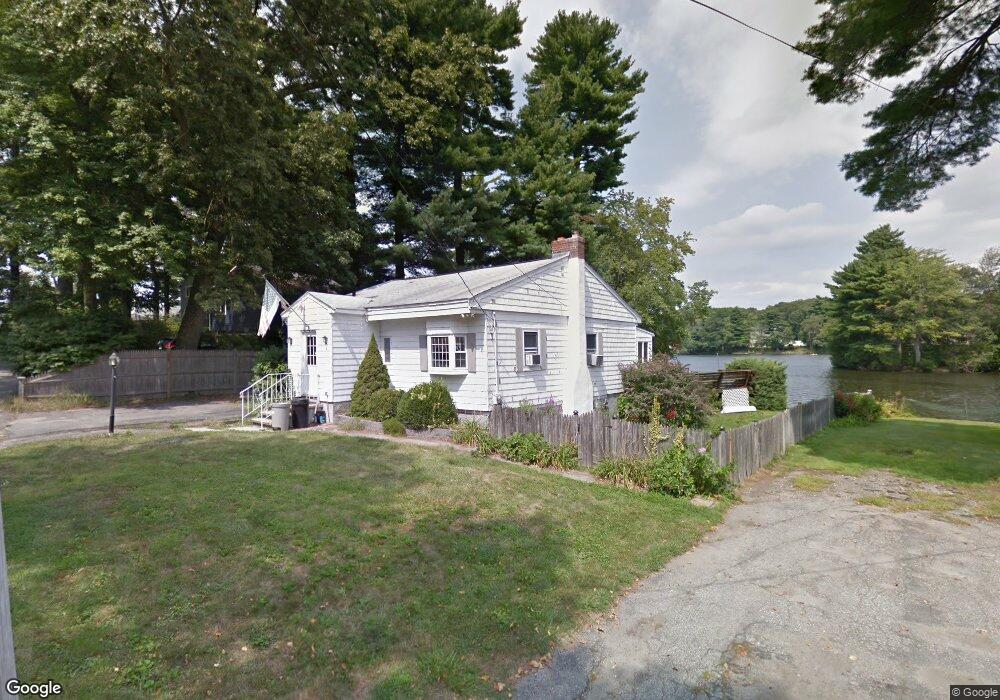
2 Colonial Rd Lynnfield, MA 01940
Estimated Value: $684,000 - $759,000
3
Beds
1
Bath
1,250
Sq Ft
$565/Sq Ft
Est. Value
About This Home
This home is located at 2 Colonial Rd, Lynnfield, MA 01940 and is currently estimated at $706,735, approximately $565 per square foot. 2 Colonial Rd is a home located in Essex County with nearby schools including Lynnfield Middle School, Lynnfield High School, and Our Lady Of Assumption School.
Ownership History
Date
Name
Owned For
Owner Type
Purchase Details
Closed on
Dec 16, 2025
Sold by
Remmes Donna J
Bought by
Firicano-Carr Christine M and Firicano Anthony J
Current Estimated Value
Purchase Details
Closed on
Oct 29, 2025
Sold by
Firicano Frank J Est and Firicano
Bought by
Firicano-Carr Christine M and Firicano Anthony J
Purchase Details
Closed on
Mar 28, 2001
Sold by
Firicano Frank C
Bought by
Firicano Frank J
Home Financials for this Owner
Home Financials are based on the most recent Mortgage that was taken out on this home.
Original Mortgage
$220,000
Interest Rate
6.96%
Mortgage Type
Purchase Money Mortgage
Purchase Details
Closed on
Nov 22, 1996
Sold by
Rothwell Leonard F
Bought by
Firicano Frank C
Create a Home Valuation Report for This Property
The Home Valuation Report is an in-depth analysis detailing your home's value as well as a comparison with similar homes in the area
Home Values in the Area
Average Home Value in this Area
Purchase History
| Date | Buyer | Sale Price | Title Company |
|---|---|---|---|
| Firicano-Carr Christine M | -- | -- | |
| Firicano-Carr Christine M | -- | -- | |
| Firicano Frank J | $275,000 | -- | |
| Firicano Frank C | $175,000 | -- |
Source: Public Records
Mortgage History
| Date | Status | Borrower | Loan Amount |
|---|---|---|---|
| Previous Owner | Firicano Frank C | $100,000 | |
| Previous Owner | Firicano Frank C | $200,000 | |
| Previous Owner | Firicano Frank C | $220,000 | |
| Previous Owner | Firicano Frank C | $45,000 |
Source: Public Records
Tax History
| Year | Tax Paid | Tax Assessment Tax Assessment Total Assessment is a certain percentage of the fair market value that is determined by local assessors to be the total taxable value of land and additions on the property. | Land | Improvement |
|---|---|---|---|---|
| 2025 | $6,514 | $616,900 | $501,500 | $115,400 |
| 2024 | $5,747 | $546,800 | $443,800 | $103,000 |
| 2023 | $5,761 | $509,800 | $421,000 | $88,800 |
| 2022 | $5,923 | $494,000 | $421,000 | $73,000 |
| 2021 | $5,730 | $431,800 | $361,400 | $70,400 |
| 2020 | $5,327 | $382,700 | $312,300 | $70,400 |
| 2019 | $5,127 | $368,600 | $298,200 | $70,400 |
| 2018 | $5,072 | $368,600 | $298,200 | $70,400 |
| 2017 | $5,079 | $368,600 | $298,200 | $70,400 |
| 2016 | $4,889 | $337,200 | $266,700 | $70,500 |
| 2015 | $4,886 | $337,200 | $266,700 | $70,500 |
Source: Public Records
Map
Nearby Homes
- 11 Elizabeth Way
- 143 Winona St
- 527 Salem St Unit 42
- 695 Salem St
- 114 Lake St
- 410 Salem St Unit 1203
- 903 Foxwood Cir Unit 903
- 344 Broadway
- 106 Winona St
- 6 Ashley Ct
- 11 Hutchins Cir
- 7 Pinewood Rd
- 20 Pine Hill Rd
- 2 Witham St
- 58 Chestnut St
- 4 Lowell St
- 12 Patricia Rd
- 8 Temi Rd
- 37 Locust St
- 9 Broadway Unit 210