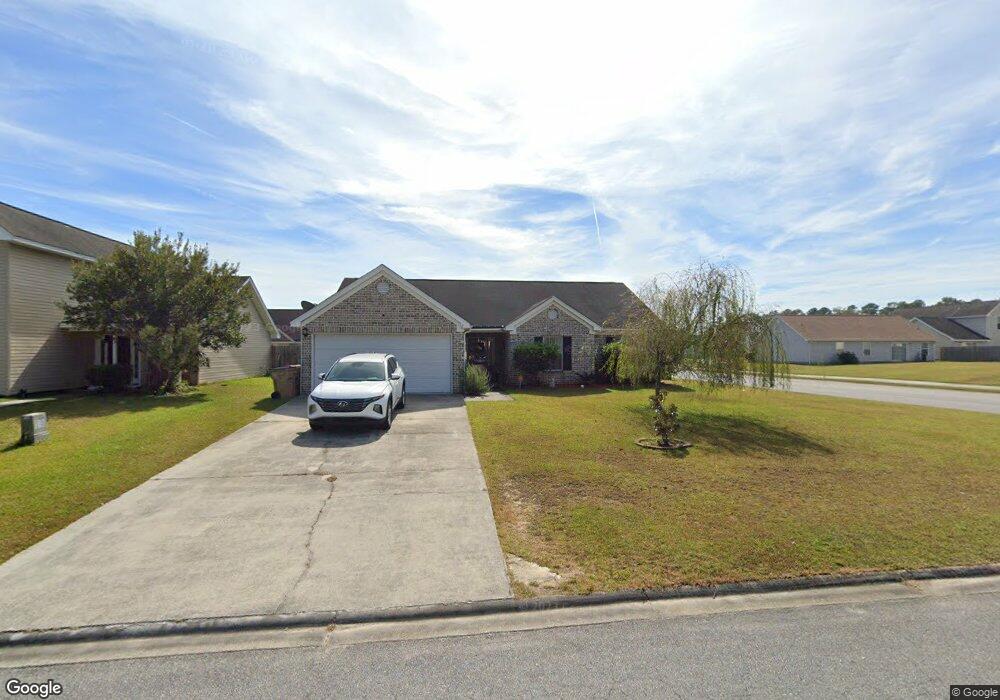
2 Cordage Cir Savannah, GA 31407
Estimated Value: $245,000 - $271,000
3
Beds
2
Baths
1,500
Sq Ft
$173/Sq Ft
Est. Value
About This Home
This home is located at 2 Cordage Cir, Savannah, GA 31407 and is currently estimated at $259,378, approximately $172 per square foot. 2 Cordage Cir is a home located in Chatham County with nearby schools including Rice Creek K-8 School and Groves High School.
Ownership History
Date
Name
Owned For
Owner Type
Purchase Details
Closed on
Jan 12, 2010
Sold by
Premier League Llc
Bought by
Tropeano Contreras Marisol
Current Estimated Value
Home Financials for this Owner
Home Financials are based on the most recent Mortgage that was taken out on this home.
Original Mortgage
$136,530
Outstanding Balance
$89,594
Interest Rate
4.94%
Mortgage Type
New Conventional
Estimated Equity
$169,784
Purchase Details
Closed on
Aug 17, 2007
Sold by
Not Provided
Bought by
Tropeano Contreras Marisol
Create a Home Valuation Report for This Property
The Home Valuation Report is an in-depth analysis detailing your home's value as well as a comparison with similar homes in the area
Home Values in the Area
Average Home Value in this Area
Purchase History
| Date | Buyer | Sale Price | Title Company |
|---|---|---|---|
| Tropeano Contreras Marisol | $133,800 | -- | |
| Tropeano Contreras Marisol | -- | -- |
Source: Public Records
Mortgage History
| Date | Status | Borrower | Loan Amount |
|---|---|---|---|
| Open | Tropeano Contreras Marisol | $136,530 |
Source: Public Records
Tax History Compared to Growth
Tax History
| Year | Tax Paid | Tax Assessment Tax Assessment Total Assessment is a certain percentage of the fair market value that is determined by local assessors to be the total taxable value of land and additions on the property. | Land | Improvement |
|---|---|---|---|---|
| 2025 | $2,988 | $92,120 | $20,000 | $72,120 |
| 2024 | $2,988 | $82,480 | $18,000 | $64,480 |
| 2023 | $2,492 | $77,120 | $18,000 | $59,120 |
| 2022 | $1,806 | $61,240 | $8,000 | $53,240 |
| 2021 | $1,809 | $53,360 | $8,000 | $45,360 |
| 2020 | $1,591 | $52,000 | $8,000 | $44,000 |
| 2019 | $1,591 | $46,000 | $8,000 | $38,000 |
| 2018 | $1,558 | $44,520 | $8,000 | $36,520 |
| 2017 | $1,467 | $44,800 | $8,000 | $36,800 |
| 2016 | $1,263 | $38,560 | $8,000 | $30,560 |
| 2015 | $1,276 | $38,920 | $8,000 | $30,920 |
| 2014 | $1,781 | $36,960 | $0 | $0 |
Source: Public Records
Map
Nearby Homes
- 10 Binnacle Ln
- 11 Cordage Cir
- 19 Halyard Dr
- 15 Newport Blvd
- 26 Halyard Dr
- 56 Bearing Cir
- 58 Bearing Cir Unit B
- 24 Transom Rd
- 32 Transom Rd
- 7 Corsair Cir
- 33 Gimbal Cir
- 150 Berrien Rd
- 16 Lanvale St
- Lot 6 Raley Rd
- Lot 5 Raley Rd
- 387 Augusta Rd
- 7538 Georgia 21
- 217 Monteith Rd
- 629 & 631 Meinhard Rd
- 1 Braxton Manor Dr