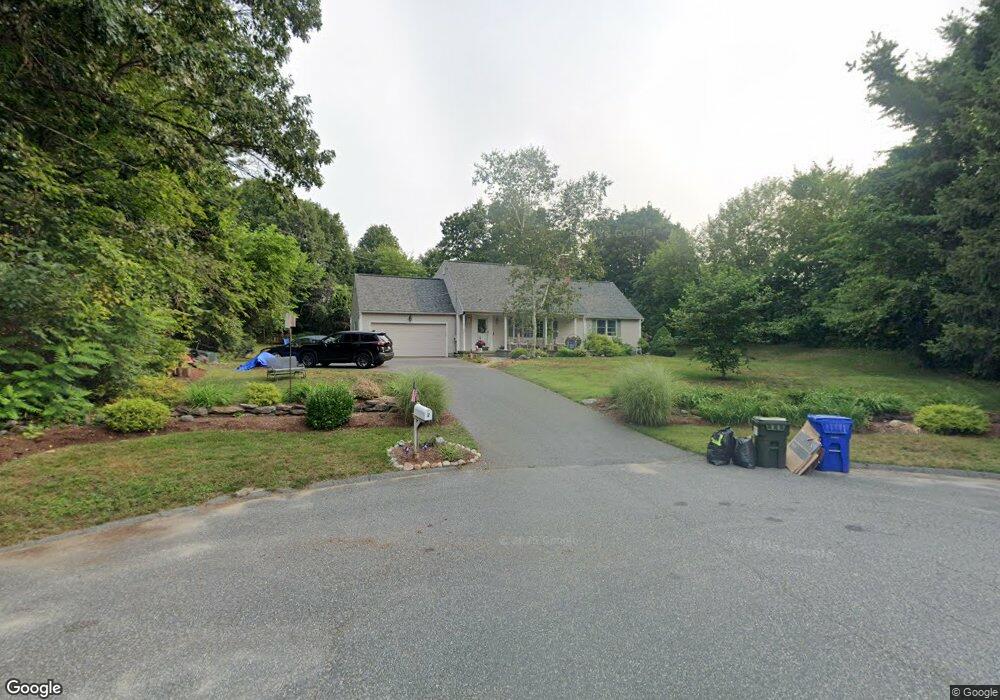
2 Crest St Wilbraham, MA 01095
Estimated Value: $428,780 - $485,000
4
Beds
2
Baths
1,854
Sq Ft
$250/Sq Ft
Est. Value
About This Home
This home is located at 2 Crest St, Wilbraham, MA 01095 and is currently estimated at $464,195, approximately $250 per square foot. 2 Crest St is a home located in Hampden County with nearby schools including Minnechaug Regional High School, Springfield International Charter School, and Wilbraham & Monson Academy.
Ownership History
Date
Name
Owned For
Owner Type
Purchase Details
Closed on
Mar 10, 2022
Sold by
Oconnor Michael L
Bought by
Oconnor Michael L and Oconnor Lorraine B
Current Estimated Value
Home Financials for this Owner
Home Financials are based on the most recent Mortgage that was taken out on this home.
Original Mortgage
$145,000
Outstanding Balance
$134,387
Interest Rate
3.55%
Mortgage Type
New Conventional
Estimated Equity
$329,808
Purchase Details
Closed on
Apr 1, 2020
Sold by
Oconnor Michael L and Oconnor Lorraine B
Bought by
Oconnor Michael L
Create a Home Valuation Report for This Property
The Home Valuation Report is an in-depth analysis detailing your home's value as well as a comparison with similar homes in the area
Home Values in the Area
Average Home Value in this Area
Purchase History
| Date | Buyer | Sale Price | Title Company |
|---|---|---|---|
| Oconnor Michael L | -- | None Available | |
| Oconnor Michael L | -- | None Available | |
| Oconnor Michael L | -- | None Available |
Source: Public Records
Mortgage History
| Date | Status | Borrower | Loan Amount |
|---|---|---|---|
| Open | Oconnor Michael L | $145,000 | |
| Closed | Oconnor Michael L | $145,000 |
Source: Public Records
Tax History
| Year | Tax Paid | Tax Assessment Tax Assessment Total Assessment is a certain percentage of the fair market value that is determined by local assessors to be the total taxable value of land and additions on the property. | Land | Improvement |
|---|---|---|---|---|
| 2025 | $6,753 | $377,700 | $99,900 | $277,800 |
| 2024 | $6,122 | $330,900 | $99,900 | $231,000 |
| 2023 | $6,038 | $311,400 | $99,900 | $211,500 |
| 2022 | $6,038 | $294,700 | $99,900 | $194,800 |
| 2021 | $5,304 | $231,000 | $107,000 | $124,000 |
| 2020 | $5,170 | $231,000 | $107,000 | $124,000 |
| 2019 | $5,079 | $233,000 | $107,000 | $126,000 |
| 2018 | $4,992 | $220,500 | $107,000 | $113,500 |
| 2017 | $4,851 | $220,500 | $107,000 | $113,500 |
| 2016 | $4,942 | $228,800 | $118,900 | $109,900 |
| 2015 | $4,777 | $228,800 | $118,900 | $109,900 |
Source: Public Records
Map
Nearby Homes
- 6 Katie St
- 24 Mcintosh Dr
- 5 Northwood Dr
- 230V Burleigh Rd
- 208 Tamarack Dr
- 59 Baldwin Dr
- 85 Baldwin Dr
- 8 Patriot Ridge Ln
- 25 Angelica Dr
- 107 Baldwin Dr
- 6 Brooklawn Rd
- 6 Hilltop Park
- 301 Tinkham Rd
- 15 Pine Acre Rd
- 16 Deerfoot Dr
- 2306 Wilbraham Rd
- 46 Holland Dr
- 17 Jeanne Marie St
- 20 Old Orchard Rd
- 60 Jeanne Marie St
Your Personal Tour Guide
Ask me questions while you tour the home.