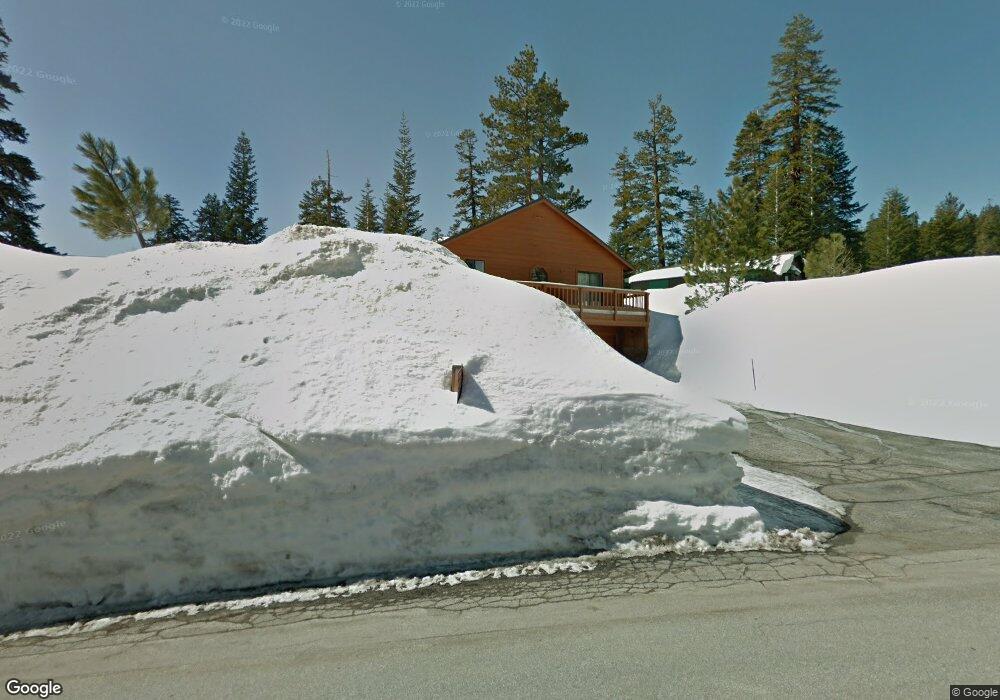
2 Crystal Ln Mammoth Lakes, CA 93546
Estimated Value: $996,789 - $1,153,000
3
Beds
3
Baths
1,652
Sq Ft
$658/Sq Ft
Est. Value
About This Home
This home is located at 2 Crystal Ln, Mammoth Lakes, CA 93546 and is currently estimated at $1,086,197, approximately $657 per square foot. 2 Crystal Ln is a home with nearby schools including Mammoth Elementary School, Mammoth Middle School, and Mammoth High School.
Ownership History
Date
Name
Owned For
Owner Type
Purchase Details
Closed on
Aug 30, 2021
Sold by
Tallas Marie Joan and Tallas Gord
Bought by
Tallas Gord and Tallas Joan Marie
Current Estimated Value
Purchase Details
Closed on
Feb 7, 2018
Sold by
Buchanan Cheryl A and Buchanan Family Trust
Bought by
Buchanan Cheryl A and Cheryl Buchanan 2017 Trust
Purchase Details
Closed on
Sep 15, 2009
Sold by
Peterson Brent D and White Brant E
Bought by
Rice Steven Andrew and Rice Therese Louise
Home Financials for this Owner
Home Financials are based on the most recent Mortgage that was taken out on this home.
Original Mortgage
$345,000
Outstanding Balance
$225,055
Interest Rate
5.14%
Mortgage Type
New Conventional
Estimated Equity
$861,142
Purchase Details
Closed on
Nov 14, 2006
Sold by
Stefanik John M and Stefanik Adrienne A
Bought by
Stefanik John M and Stefanik Adrienne A
Create a Home Valuation Report for This Property
The Home Valuation Report is an in-depth analysis detailing your home's value as well as a comparison with similar homes in the area
Home Values in the Area
Average Home Value in this Area
Purchase History
| Date | Buyer | Sale Price | Title Company |
|---|---|---|---|
| Tallas Gord | -- | None Available | |
| Buchanan Cheryl A | -- | None Available | |
| Rice Steven Andrew | $595,000 | Inyo Mono Title Company | |
| Stefanik John M | -- | None Available |
Source: Public Records
Mortgage History
| Date | Status | Borrower | Loan Amount |
|---|---|---|---|
| Open | Rice Steven Andrew | $345,000 |
Source: Public Records
Tax History Compared to Growth
Tax History
| Year | Tax Paid | Tax Assessment Tax Assessment Total Assessment is a certain percentage of the fair market value that is determined by local assessors to be the total taxable value of land and additions on the property. | Land | Improvement |
|---|---|---|---|---|
| 2024 | $3,559 | $311,712 | $76,542 | $235,170 |
| 2023 | $3,559 | $305,601 | $75,042 | $230,559 |
| 2022 | $3,518 | $299,610 | $73,571 | $226,039 |
| 2021 | $3,421 | $293,736 | $72,129 | $221,607 |
| 2020 | $3,395 | $290,725 | $71,390 | $219,335 |
| 2019 | $3,321 | $285,026 | $69,991 | $215,035 |
| 2018 | $3,267 | $279,438 | $68,619 | $210,819 |
| 2017 | $3,097 | $273,960 | $67,274 | $206,686 |
| 2016 | $3,046 | $268,589 | $65,955 | $202,634 |
| 2015 | $3,033 | $264,556 | $64,965 | $199,591 |
| 2014 | $2,985 | $259,375 | $63,693 | $195,682 |
Source: Public Records
Map
Nearby Homes
- 464 Canyon Blvd Unit 133
- 75 Crystal Ln Unit 71
- 41 Convict Place Unit 30
- 490 Hillside Dr Unit 39-020-03
- 221 Canyon Blvd Unit 213
- 221 Canyon Blvd Unit 102
- 221 Canyon Blvd Unit Mammoth Estates 115
- 91 Lakeview Blvd Unit 12-S
- 248 Mammoth Slopes Dr Unit 23
- 248 Mammoth Slopes Dr Unit 80
- 66 Jahan Dr
- 66 Jahan Dr Unit 16
- 757 Canyon Blvd Unit 26
- 50 Hillside #234 Dr Unit 234
- 125 Lakeview Blvd #5 Unit 5
- 195 Hillside Dr Unit 13
- 194 Hillside #15 Dr Unit 15
- 98 Aspen Ln
- 98 Aspen Ln Unit 9
- 50 Hillside Dr Unit 546
- 16 Crystal Ln
- 166 Ridgecrest Dr
- 152 Ridgecrest Dr
- 464 Canyon Blvd
- 464 Canyon Blvd Unit 1
- 478 Canyon Blvd
- 478 Canyon Blvd Unit 2
- 478 Canyon Blvd Unit Mammoth Slopes III L
- 3 Crystal Ln
- 28 Crystal Ln Unit 43
- 28 Crystal Ln
- 21 Crystal Ln
- 21 Crystal Ln Unit 69
- 167 Ridgecrest Dr
- 450 Canyon Blvd Unit 40
- 450 Canyon Blvd
- 492 Canyon Blvd
- 138 Ridgecrest Dr
- 189 Ridgecrest Dr