Estimated Value: $537,000 - $615,000
3
Beds
2
Baths
1,094
Sq Ft
$513/Sq Ft
Est. Value
About This Home
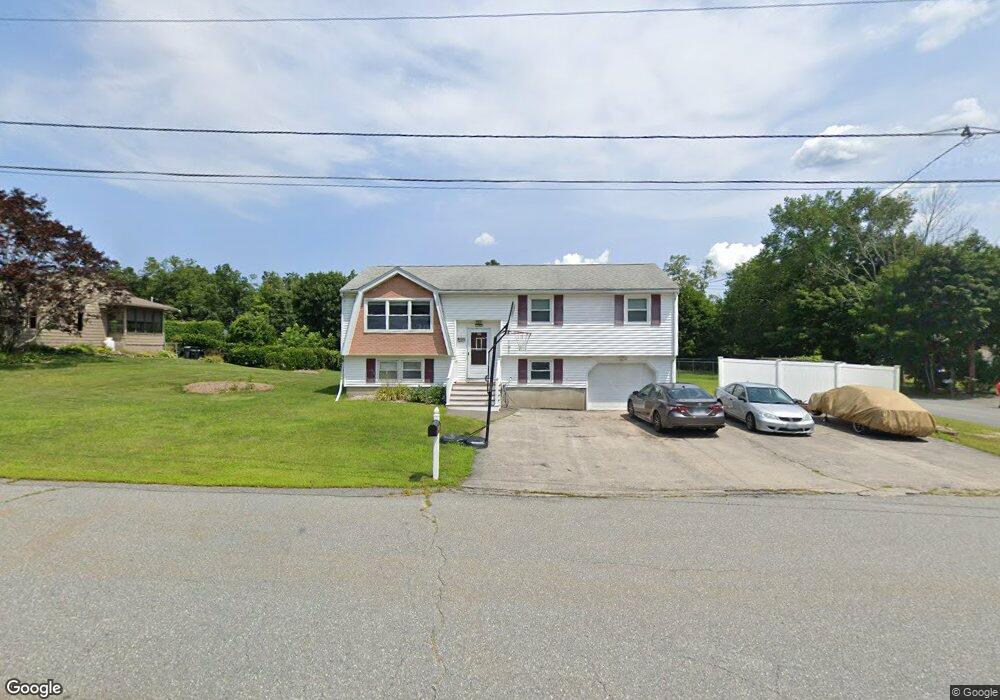
This home is located at 2 Darryl Ln, Salem, NH 03079 and is currently estimated at $561,103, approximately $512 per square foot. 2 Darryl Ln is a home located in Rockingham County with nearby schools including Mary A. Fisk Elementary School, Woodbury School, and Salem High School.
Ownership History
Date
Name
Owned For
Owner Type
Purchase Details
Closed on
Sep 20, 2011
Sold by
Fnma
Bought by
Phan Thinh Quang and Patel Falguni A
Current Estimated Value
Home Financials for this Owner
Home Financials are based on the most recent Mortgage that was taken out on this home.
Original Mortgage
$168,000
Outstanding Balance
$115,703
Interest Rate
4.38%
Mortgage Type
Purchase Money Mortgage
Estimated Equity
$445,400
Purchase Details
Closed on
Jun 1, 2011
Sold by
Brisendine Thomas L and Fnma
Bought by
Federal National Mortgage Association
Purchase Details
Closed on
Jul 1, 1996
Sold by
Coletti Salvatore and Coletti Tonya S
Bought by
Brisendine Thomas L and Brisendine Paula M
Create a Home Valuation Report for This Property
The Home Valuation Report is an in-depth analysis detailing your home's value as well as a comparison with similar homes in the area
Purchase History
| Date | Buyer | Sale Price | Title Company |
|---|---|---|---|
| Phan Thinh Quang | $210,000 | -- | |
| Federal National Mortgage Association | $238,800 | -- | |
| Brisendine Thomas L | $121,000 | -- |
Source: Public Records
Mortgage History
| Date | Status | Borrower | Loan Amount |
|---|---|---|---|
| Open | Brisendine Thomas L | $168,000 | |
| Previous Owner | Brisendine Thomas L | $230,000 | |
| Previous Owner | Brisendine Thomas L | $63,600 | |
| Previous Owner | Brisendine Thomas L | $30,000 |
Source: Public Records
Tax History
| Year | Tax Paid | Tax Assessment Tax Assessment Total Assessment is a certain percentage of the fair market value that is determined by local assessors to be the total taxable value of land and additions on the property. | Land | Improvement |
|---|---|---|---|---|
| 2024 | $7,234 | $411,000 | $161,900 | $249,100 |
| 2023 | $6,971 | $411,000 | $161,900 | $249,100 |
| 2022 | $6,597 | $411,000 | $161,900 | $249,100 |
| 2021 | $6,568 | $411,000 | $161,900 | $249,100 |
| 2020 | $5,875 | $266,800 | $115,500 | $151,300 |
| 2019 | $5,864 | $266,800 | $115,500 | $151,300 |
| 2018 | $5,766 | $266,800 | $115,500 | $151,300 |
| 2017 | $5,420 | $260,100 | $115,500 | $144,600 |
| 2016 | $5,314 | $260,100 | $115,500 | $144,600 |
| 2015 | $5,037 | $235,500 | $118,100 | $117,400 |
| 2014 | $4,896 | $235,500 | $118,100 | $117,400 |
| 2013 | $4,818 | $235,500 | $118,100 | $117,400 |
Source: Public Records
Map
Nearby Homes
- 4 Darryl Ln
- 33 Old Rockingham Rd
- 3 Darryl Ln
- 29 Old Rockingham Rd
- 5 Dennis Dr
- 6 Darryl Ln
- 7 Dennis Dr
- 37 Old Rockingham Rd
- 5 Darryl Ln
- 9 Dennis Dr
- 27 Old Rockingham Rd
- 10 Dennis Dr
- 8 Darryl Ln
- 7 Darryl Ln
- 6 Joseph Rd
- 4 Rena Ave
- 39 Old Rockingham Rd
- 11 Dennis Dr
- 32 Old Rockingham Rd
- 30 Old Rockingham Rd
Your Personal Tour Guide
Ask me questions while you tour the home.